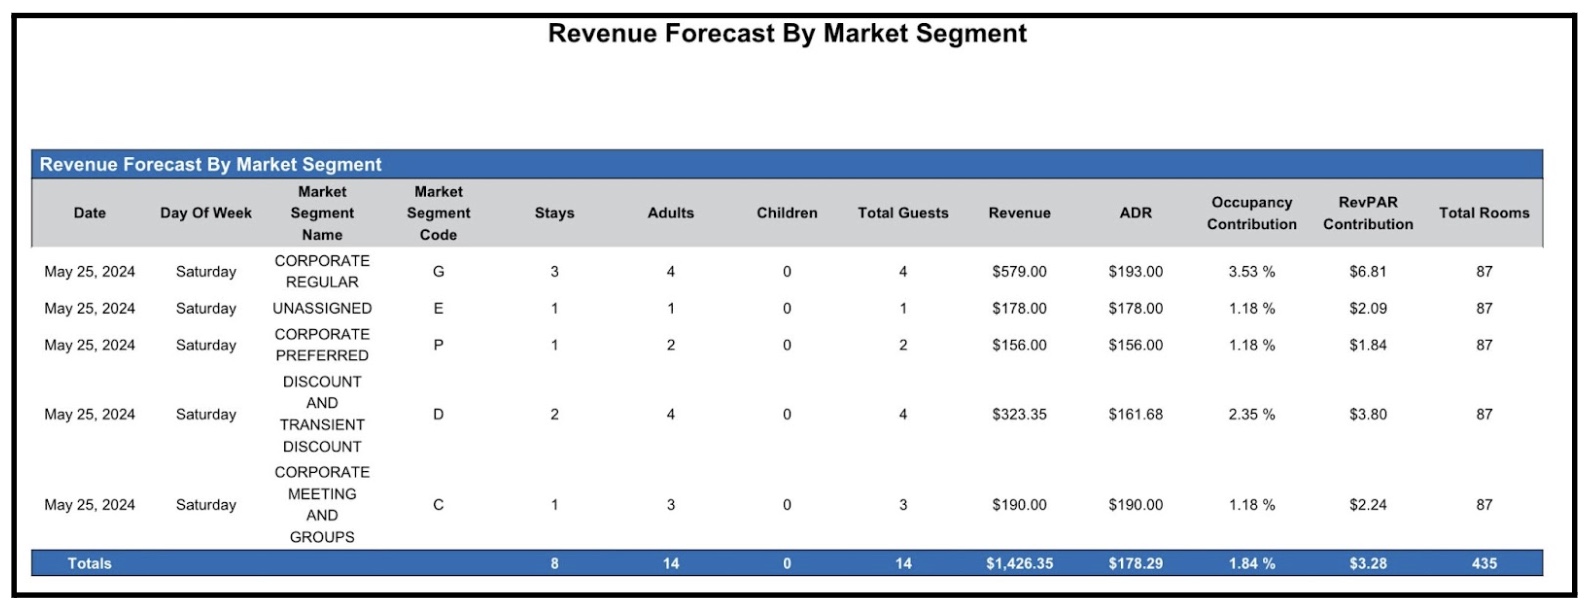
Revenue Forecast by Market Segment .ng
Revenue Forecast by Market Segment
Report Description: The Revenue Forecast by Market Segment report offers a forward-looking overview of revenue and occupancy data categorized by market segments for specific dates, aiding property managers in revenue planning and segmentation strategies, providing insights into stays, revenue, ADR, occupancy contribution, and RevPAR contribution by market segment. The report also displays all potential segmentation values, even when revenue is zero.
Date Range: The report will render the data for up to 365 days in the future
Available Report Columns for Following Sections:
Column Name | Column Description | Amount Includes Taxes and Fees | Calculation |
Date | The date for which the forecast is provided | Not Applicable | Not Applicable |
Day of Week | The day of the week corresponding to the date | Not Applicable | Not Applicable |
Market Segment Name | The name of the market segment for which the forecast is generated | Not Applicable | Not Applicable |
Market Segment Code | The code of the market segment for which the forecast is generated | Not Applicable | Not Applicable |
Stays | The forecasted number of stays or reservations associated with the market segment on the given date | Not Applicable | =sum(forecasted number of stays) |
Adult | Number of adult guests associated with the reservation | Not Applicable | =sum(adults) |
Children | Number of child guests associated with the reservation | Not Applicable | =sum(children) |
Total Guests | Total guests associated with the reservation | Not Applicable | =sum(adults) + (children) |
Revenue | The forecasted revenue expected for the specified market segment | NO | =sum(market segment revenue) |
ADR | The forecasted average revenue generated per occupied room for the market segment | NO | ADR = (revenue / occupied rooms) |
Occupancy Contribution | The contribution of the market segment to the overall occupancy percentage forecast | Not Applicable | occupancy contribution = (stays) / (inventory - OOO) |
RevPAR Contribution | The contribution of the market segment to the overall revenue per available room forecast | NO | RevPAR contribution = (revenue / total hotel inventory) |
Total Rooms | Total number of rooms
Total rooms does not consider OOO for the day | Not Applicable | =sum(total inventory) |

Misc Report Information:
Available Features:
Export: ability to download and save the file into an alternate format.
Filter: filter a range of data based on criteria defined by the user.
Highlight: also known as conditional formatting is the ability to highlight certain values making them easier to identify.
Bar Graph: ability to view Revenue, Stays, Adults, Children, Total Guests, Total Rooms data in a bar chart.
Grouping: ability to view the data grouped by: All, Market Segment Name, Day of Week
Pie Chart: ability to view grouped data in a Pie Chart view.
Available Configuration:
User Preferences: allows the user to customize their report view by repositioning or removing columns.
Property Preferences: allows the property to customize the report view for all users by repositioning or removing columns.
Baseline Configuration:
Property Preferences Settings:
Following columns to be disabled for initial deployment:
Not Applicable
