
Turn Away Reason Code Report Overview
Parent Hub: 📈 Revenue & Analytics
Category: 🔭 Yield & Forecasting
Target Roles: Directors of Revenue Management, Revenue Analysts, General Managers, Front Office Managers, Call Center Supervisors, Sales & Marketing Directors
Key Value: Monitor unaccommodated demand and lost booking opportunities, evaluate primary denial reasons, track staff-level turn-away logging compliance, identify booking channel source constraints, and refine pricing, restriction, and capacity strategies.
Executive Summary
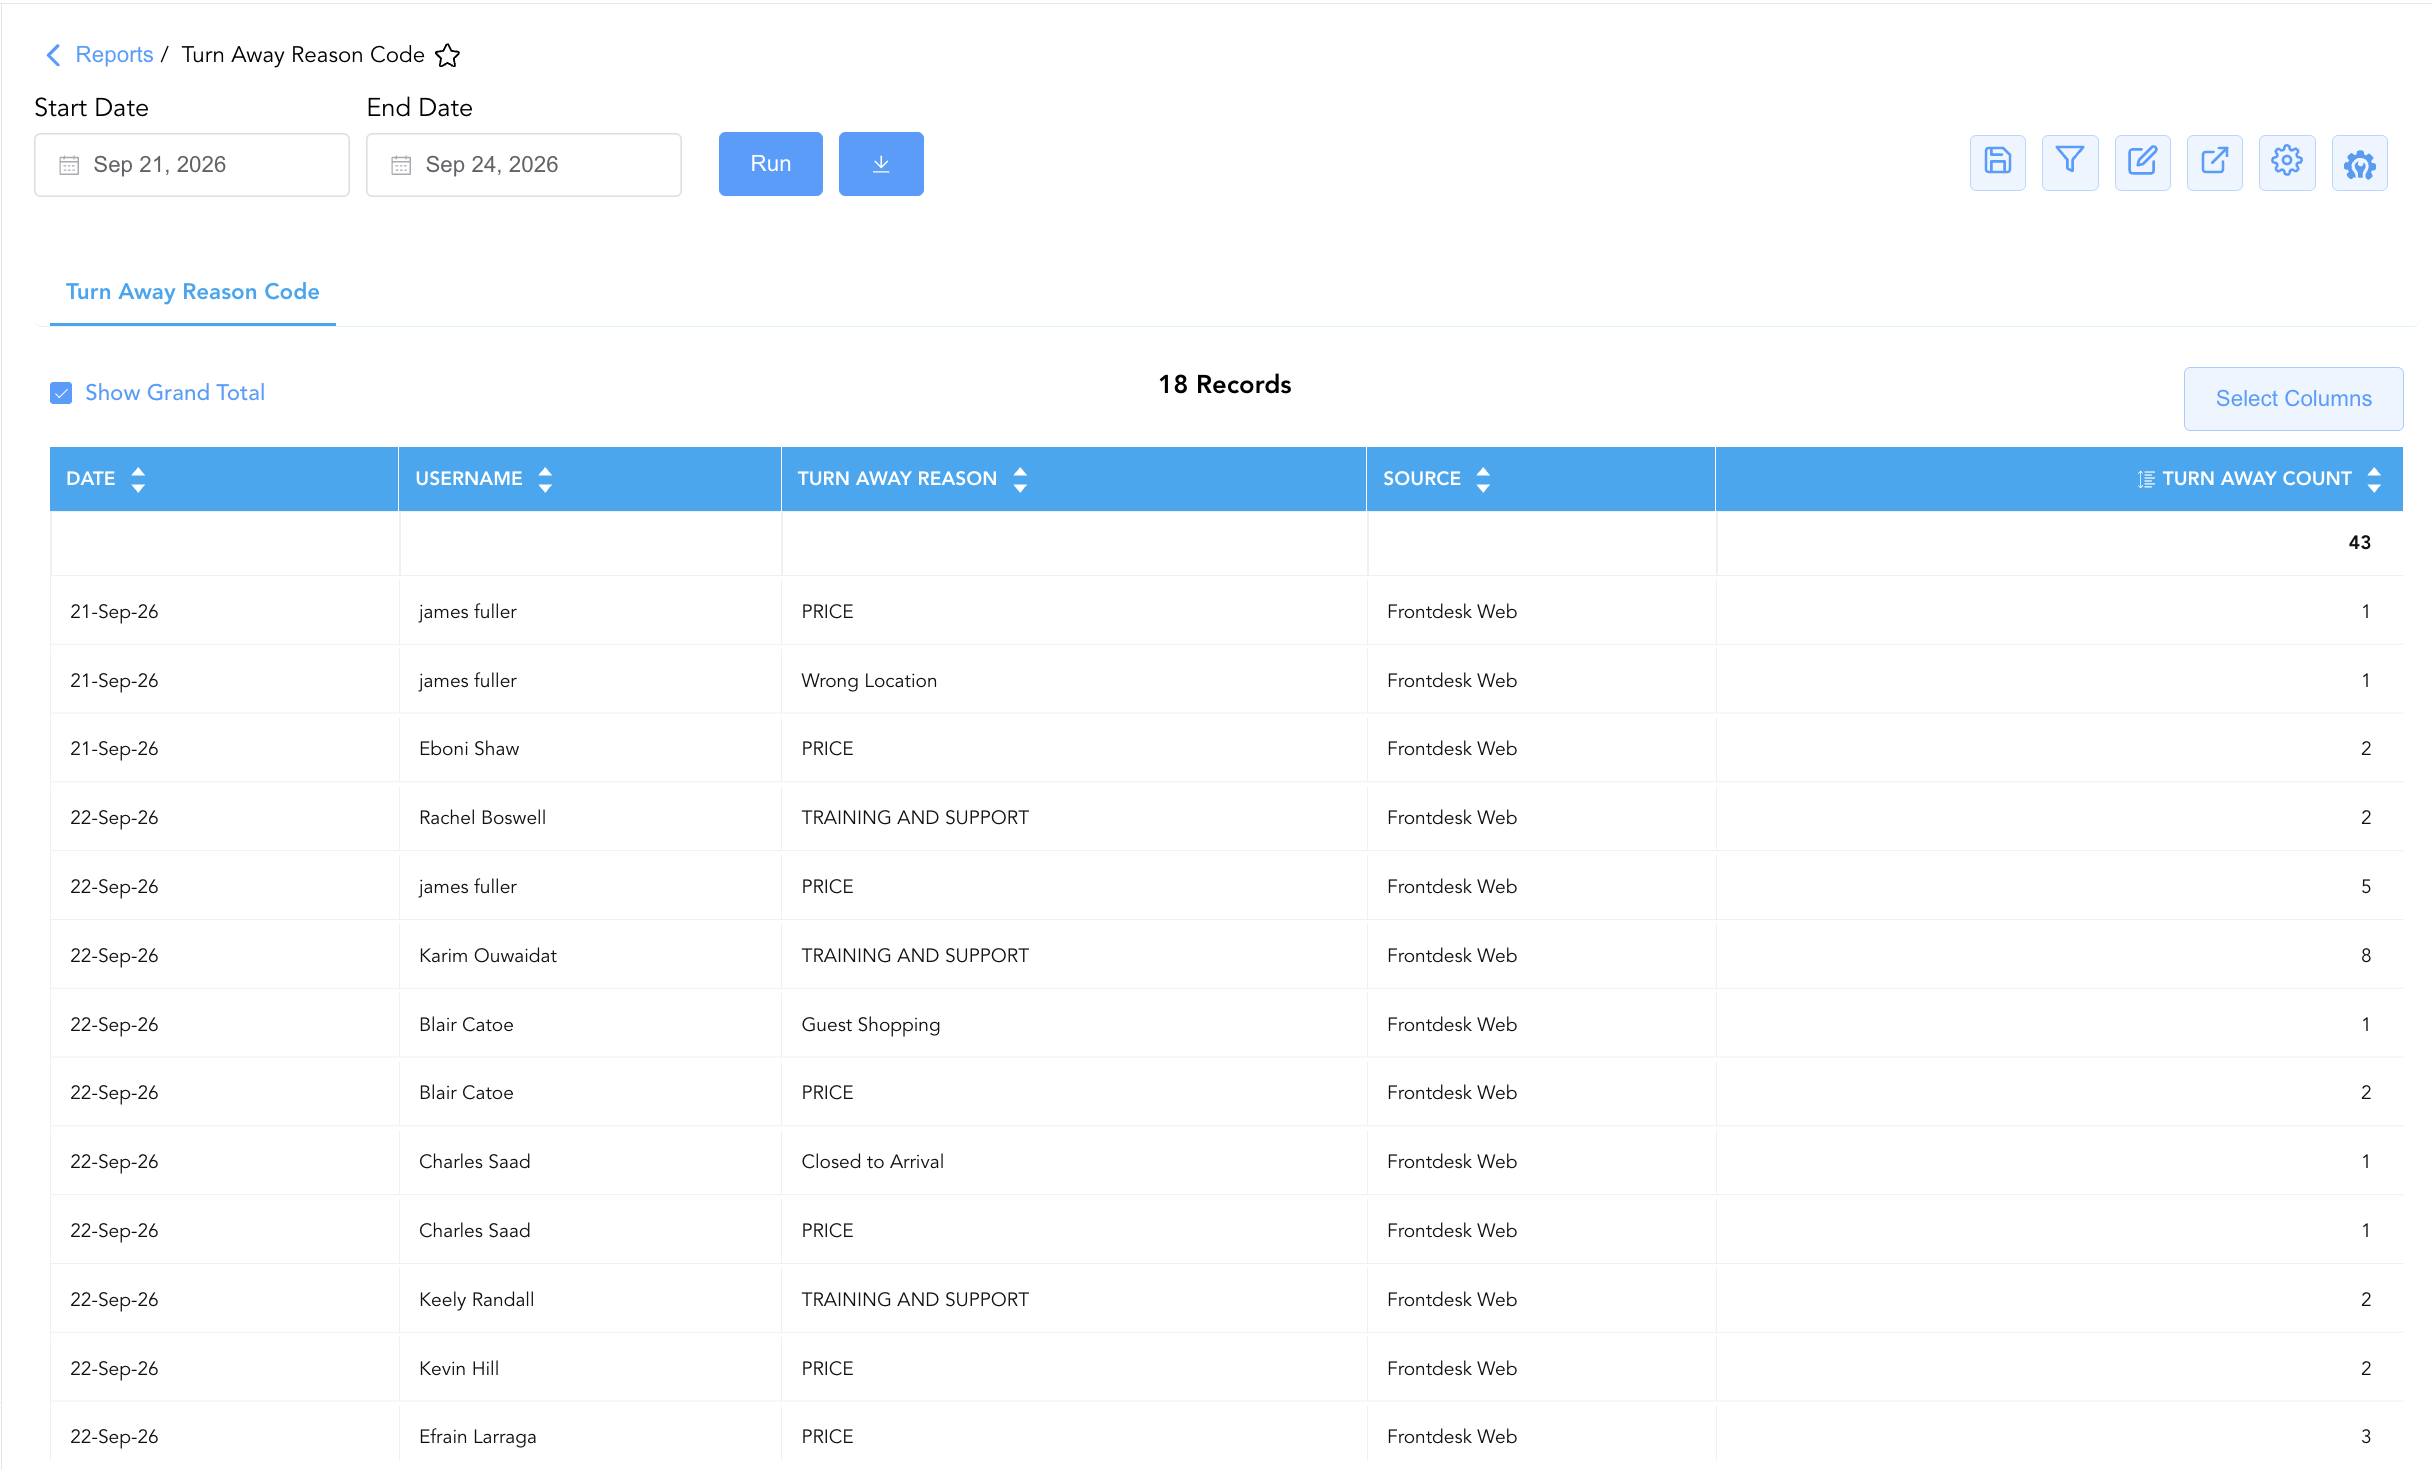
The Turn Away Reason Code Report is a primary unaccommodated demand audit and lost revenue document within the 🔭 Yield & Forecasting category of the 📈 Revenue & Analytics hub. Designed to capture potential stay inquiries that failed to convert into confirmed reservations, it logs every recorded turn-away event alongside the specific reason, staff member, booking channel, and date.
-
By mapping operational inquiry parameters (Date, Username, Source) to denial classifications (Turn Away Reason) and volume metrics (Turn Away Count), this report enables revenue managers, call center supervisors, and general managers to evaluate lost demand trends, identify price resistance thresholds, audit channel or rate restrictions, and uncover uncaptured market potential.
Key Capabilities
-
Unaccommodated Demand Audit: Itemizes lost inquiry occurrences (
Turn Away Count) to quantify total uncaptured property demand over specified date ranges. -
Denial Reason Classification: Categorizes booking rejections by specific operational and commercial reasons (e.g.,
PRICE,Wrong Location,Guest Shopping,Closed to Arrival,TRAINING AND SUPPORT). -
Staff Logging Traceability: Identifies individual staff credentials (
Username) logging turn-away events to monitor front desk and central reservations logging compliance. -
Booking Origin Channel Tracking: Captures the booking engine or PMS module origin (
Source, e.g.,Frontdesk Web) through which the inquiry was received. -
Time-Series Inquiry Trend Monitoring: Tracks day-by-day turn-away fluctuations (
Date) to correlate lost demand spikes with specific high-demand event dates or restriction periods.
Report Views & Functional Breakdown
The Turn Away Reason Code Report presents unaccommodated demand data in a unified single-table ledger that supports three key analytical perspectives:
┌────────────────────────────────────────────────────────────────────────┐
│                   TURN AWAY REASON CODE REPORT                         │
├────────────────────────────────────────────────────────────────────────┤
│                         Unified Matrix View                            │
├──────────────────────────┬──────────────────────────┬──────────────────┤
│ 1. Lost Demand &         │ 2. Staff Compliance &    │ 3. Channel &     │
│    Reason Audit          │    User Activity         │    Source Origin │
└──────────────────────────┴──────────────────────────┴──────────────────┘
1. Lost Demand & Reason Audit
Monitors total lost inquiries grouped by primary denial reasons to evaluate pricing resistance and restriction impacts.
-
Primary Use: Identifying top drivers of unaccommodated business, evaluating if price sensitivity is causing lost bookings (
PRICE), and assessing restriction-driven denials (Closed to Arrival). -
Key Metrics: Date, Turn Away Reason, Turn Away Count.
2. Staff Compliance & User Activity
Correlates recorded turn-away entries directly with individual staff member credentials.
-
Primary Use: Auditing front desk and reservation agent turn-away logging frequency, identifying training needs (
TRAINING AND SUPPORT), and ensuring full data capture compliance. -
Key Metrics: Date, Username, Turn Away Reason, Turn Away Count.
3. Channel & Source Origin
Tracks the operational interface through which the lost booking inquiry was processed.
-
Primary Use: Distinguishing between direct property voice inquiries (
Frontdesk Web), central reservations, or web booking engine turn-aways. -
Key Metrics: Date, Source, Turn Away Reason, Turn Away Count.
Data Dictionary (Dynamic View Columns)
Customize your default view using the Configure (⚙️) icon on the report page. Below is the full data dictionary representing every column available in this report:
💡 Unaccommodated Demand Note: Turn Away Count reflects the tally of lost booking inquiries where a reservation was not completed. This data represents uncaptured market demand and is critical for unconstrained demand forecasting.
|
Column Name |
Description |
Data Source / System Mapping |
Includes Taxes & Fees? |
|
Date |
Calendar date on which the turn-away event was logged in the system. |
PMS Inquiry Audit > Log Date |
N/A |
|
Username |
Staff login ID or name of the employee who recorded the turn-away. |
System Security > User ID / Name |
N/A |
|
Turn Away Reason |
Standardized reason code or category explaining why the booking was not completed (e.g., PRICE, Closed to Arrival, Guest Shopping). |
PMS Turn Away Setup > Reason Code |
N/A |
|
Source |
System interface or booking channel through which the inquiry was made (e.g., Frontdesk Web). |
PMS / CRS > Inquiry Channel |
N/A |
|
Turn Away Count |
Total number of lost inquiry units logged for the specific date, user, source, and reason combination. |
SUM(Logged Turn Away Inquiries) |
N/A |
Customization & Platform Features
User & Property Preferences
-
Personal Preference: Tailor your individual view by hiding or dragging columns. Your preferences save automatically for future sessions.
-
Property Defaults: System Admins can configure standard default layouts across all property users to streamline operational reporting. To maximize audit efficiency, group the columns into the below logical blocks.
-
Temporal & Staff Audit (Cols 1–2):
Date|Username -
Reason & Source Mapping (Cols 3–4):
Turn Away Reason|Source -
Inquiry Volume Metrics (Col 5):
Turn Away Count
-
Report Toolbar & Quick Actions
Use the top-right toolbar icons on the report page to manage and export your data view:
|
Icon |
Action / Feature |
Description |

|
Knowledge Article |
Opens the knowledge base article to learn how to interpret this report. |

|
Saved Views |
Saves your column filtering, sorting, and highlight preferences so you can easily reload your custom view later without reconfiguring the report. |

|
Filter |
Opens filter controls to isolate specific data within a column based on your selected criteria. |

|
Highlight |
Highlights column values in a designated color based on selected conditions. |

|
Export |
Exports and downloads the report in various formats (Excel, PDF, CSV) for offline analysis or printing. |

|
Configure |
Opens column selection controls to toggle visibility, reorder columns, or hide rows with all zeros. |

|
Additional Configuration |
Provides advanced report configuration and display formatting options to customize data presentation. |
Advanced Controls
-
Exporting & Unconstrained Demand Analysis: Download in Excel or PDF format to support weekly revenue meetings, pricing strategy reviews, and unconstrained demand model calculations.
-
Filtering: Filter data by specific
Turn Away Reason(e.g., isolatePRICEdenials) or filter by specificUsernameto audit staff activity. -
Highlighting (Conditional Formatting): Apply custom rules to automatically highlight high turn-away counts or flag price-resistance spikes.
🔗 Related Reports & Next Steps
Within 📈 Revenue & Analytics & 🔭 Yield & Forecasting:
-
Booking Pace – Multi-section tracking report evaluating confirmed booking velocity across Revenue, Rooms Sold, ADR, and Occupancy.
-
Occupancy Forecast and History – Comprehensive daily overview tracking historical and forecasted occupancy, revenue, and movement counters.
-
Market Segment Details Forecast – Forward-looking demand forecast breakdown by master market segment and rate code.
Cross-Pillar Deep Dives:
-
🏷️ Rate Management: Reconcile price-related turn-aways against Rate Code Configuration, Rate Plan Summary, and Discrepant Rates.
-
🥧 Market & Segmentation: Analyze lost inquiries against Market Segment Overview and Local Market Segment to assess market demand potential.