
Event Covers Report Overview
Parent Hub: 🤝 Sales, Groups & Events Reports
Category: 🥂 Event Management (EventKey)
Target Roles: Catering & Event Directors, Banquet Operations Managers, Executive Chefs, Food & Beverage Controllers, Sales Managers, General Managers
Key Value: Monitor guest cover headcounts across catering functions, compare expected versus guaranteed and actual covers, evaluate function space and package financial yields, and audit daily banquet attendance alongside attached room block revenues.
Date Parameter: Date Range Selector (Start & End) | Past & Future | Maximum Window: None
Executive Summary
The Event Covers Report is an essential catering operations audit, banquet headcount control, and event revenue analysis document within the 🥂 Event Management (EventKey) category of the 🤝 Sales, Groups & Events Reports hub. Designed to provide comprehensive visibility over guest attendance ("covers") and financial earnings generated by property banquets and catered meetings, it itemizes cover counts, function schedules, and revenue contributions across specified reporting periods.
-
By organizing catering cover data into 3 defined report sections: Covers By Sub Event, Covers By Date, and Covers By Event, this report enables catering directors, executive chefs, and hotel controllers to evaluate granular sub-event function headcounts (
Covers By Sub Event), daily property-wide cover and revenue totals (Covers By Date), and master event-level financial yields (Covers By Event). It correlates execution dates (Date) and event lifecycle states (Event Status, e.g.,ENDED,CONFIRMED,INQUIRY,CANCELLED) with function classifications (Event Classification,Event Name,Sub Event Name,Event Confirmation Number), operating schedules (Sub Event Start Time,Sub Event End Time), cover headcount metrics (Total Expected,Total Guaranteed,Total Actual,Total Covers), and itemized revenue postings (Space Revenue,Package Revenue,Total Group Block Revenue,Room Revenue,Total Revenue).
Key Capabilities
-
Three-Section Multi-Level Cover Structure: Evaluates function-level cover details (
Covers By Sub Event), daily cover summaries (Covers By Date), and master event financial yields (Covers By Event). -
Granular Banquet Headcount Audit: Tracks cover progression across planning and execution stages by comparing operational planning headcounts (
Total Expected), contractual billing minimums (Total Guaranteed), and final physical attendance (Total Actual). -
Sub-Event Function Timeline Tracking: Captures sub-event function titles (
Sub Event Name), master confirmation IDs (Event Confirmation Number), and exact operating hours (Sub Event Start Time,Sub Event End Time). -
Multi-Departmental Revenue Correlation: Itemizes function space rental fees (
Space Revenue), bundled catering package earnings (Package Revenue), attached group block lodging yields (Total Group Block Revenue,Room Revenue), and net financial totals (Total Revenue). -
Event Classification Oversight: Categorizes cover production across standardized event purpose types (
Event Classification, e.g.,Holiday Party,Large Meeting,Trade Show,Corporate).
Report Views & Functional Breakdown
The Event Covers Report presents catering attendance and revenue data across 3 defined sections:
┌────────────────────────────────────────────────────────────────────────┐
│                        EVENT COVERS REPORT                             │
├────────────────────────────────────────────────────────────────────────┤
│                       3 Defined Report Sections                        │
├──────────────────────────┬──────────────────────────┬──────────────────┤
│ 1. Covers By Sub Event   │ 2. Covers By Date        │ 3. Covers By    │
│    (Function Headcounts) │    (Daily Totals)        │    Event (Yield) │
└──────────────────────────┴──────────────────────────┴──────────────────┘
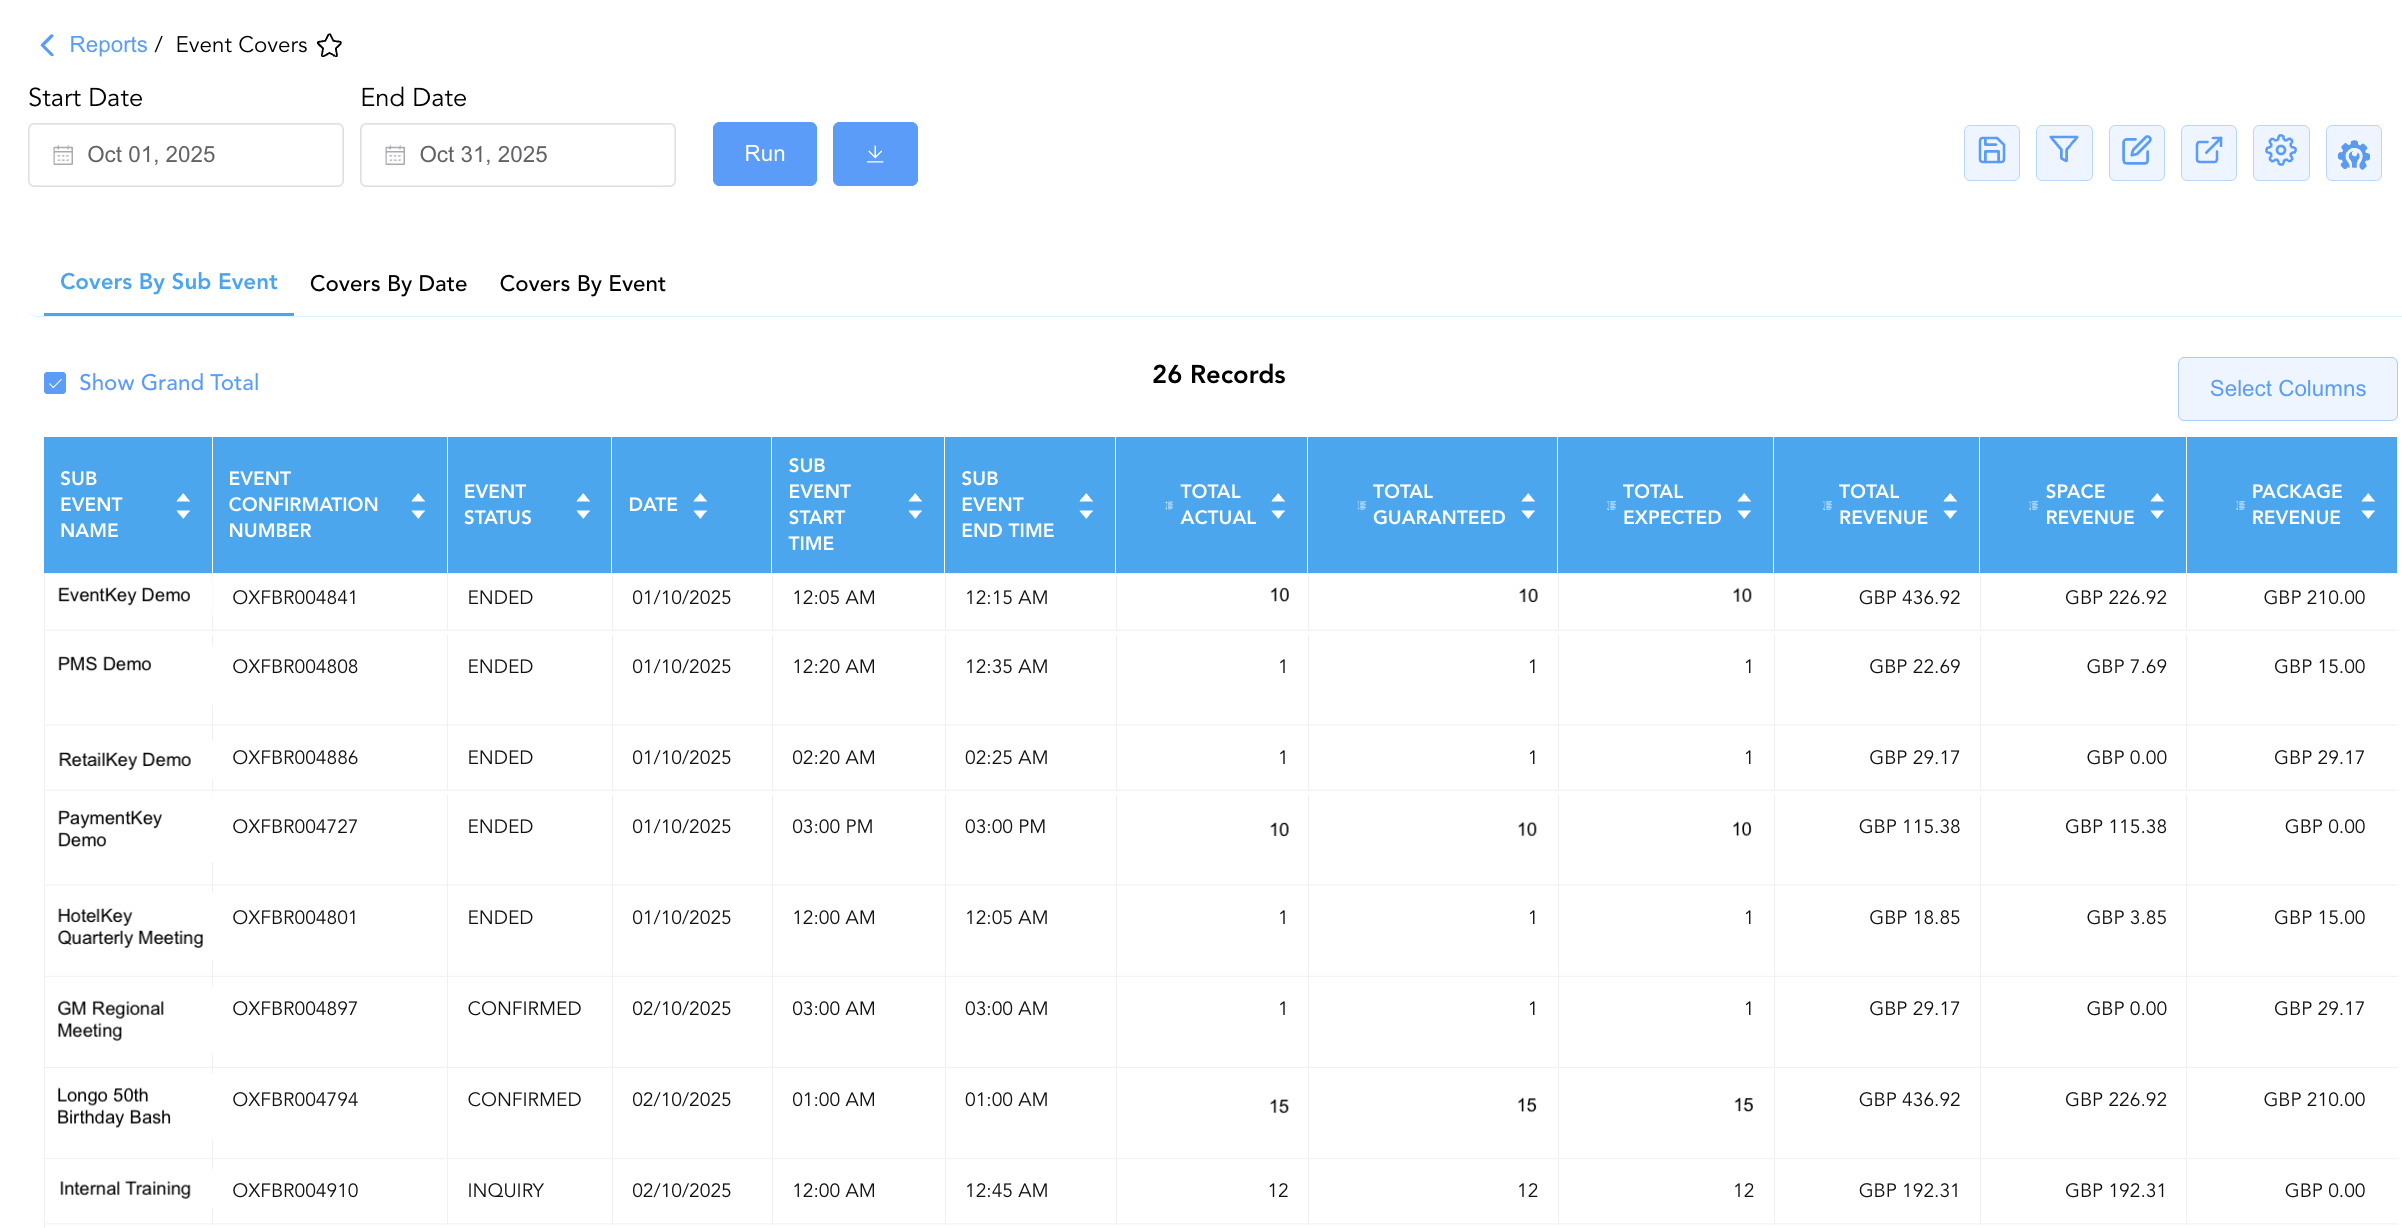
1. Covers By Sub Event Section (Function Headcounts)
Monitors line-item sub-event functions, detailing operating times, event classifications, sub-event titles, confirmation numbers, expected/guaranteed/actual cover headcounts, space rental fees, package earnings, and revenue yields.
-
Primary Use: Reviewing function-level cover commitments with kitchen and banquet service teams, verifying guaranteed cover billing, and auditing sub-event revenue.
-
Key Metrics: Date, Event Status, Sub Event Start Time, Sub Event End Time, Event Classification, Sub Event Name, Event Confirmation Number, Total Expected, Total Guaranteed, Total Actual, Space Revenue, Package Revenue, Total Revenue.
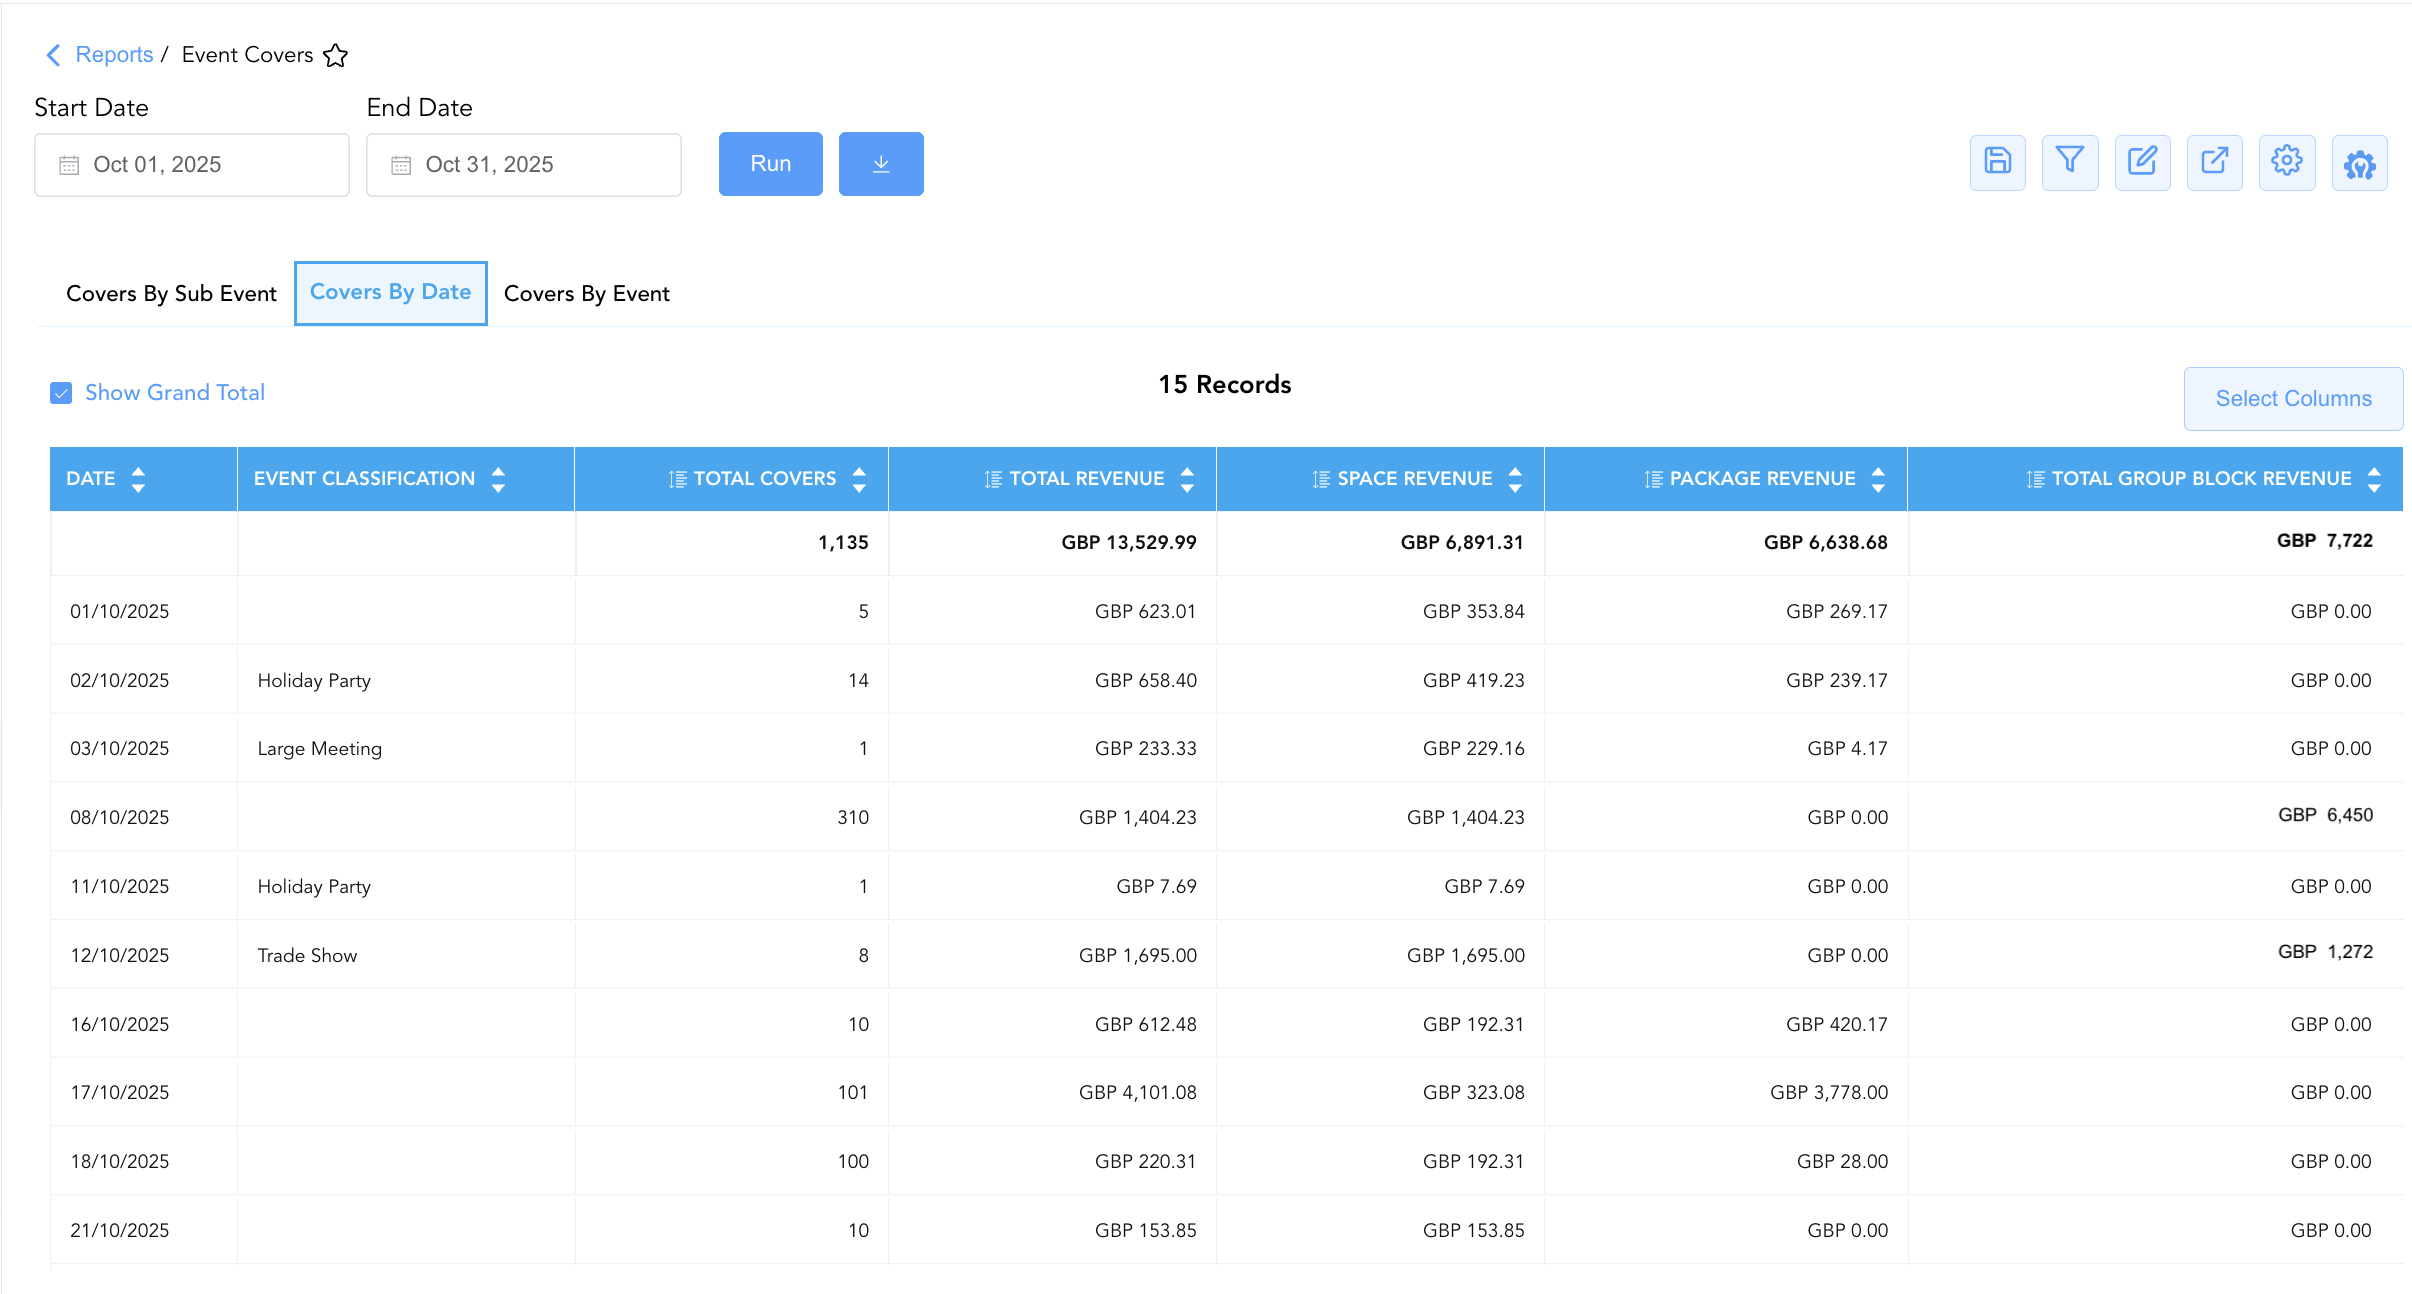
2. Covers By Date Section (Daily Totals)
Aggregates total daily guest cover headcounts, space rental earnings, associated group room block revenues, package earnings, and total net revenue for each calendar date.
-
Primary Use: Evaluating daily catering volume trends, forecasting kitchen staffing and food purchasing requirements, and tracking daily event revenue yield.
-
Key Metrics: Date, Event Classification, Total Covers, Space Revenue, Total Group Block Revenue, Package Revenue, Total Revenue.
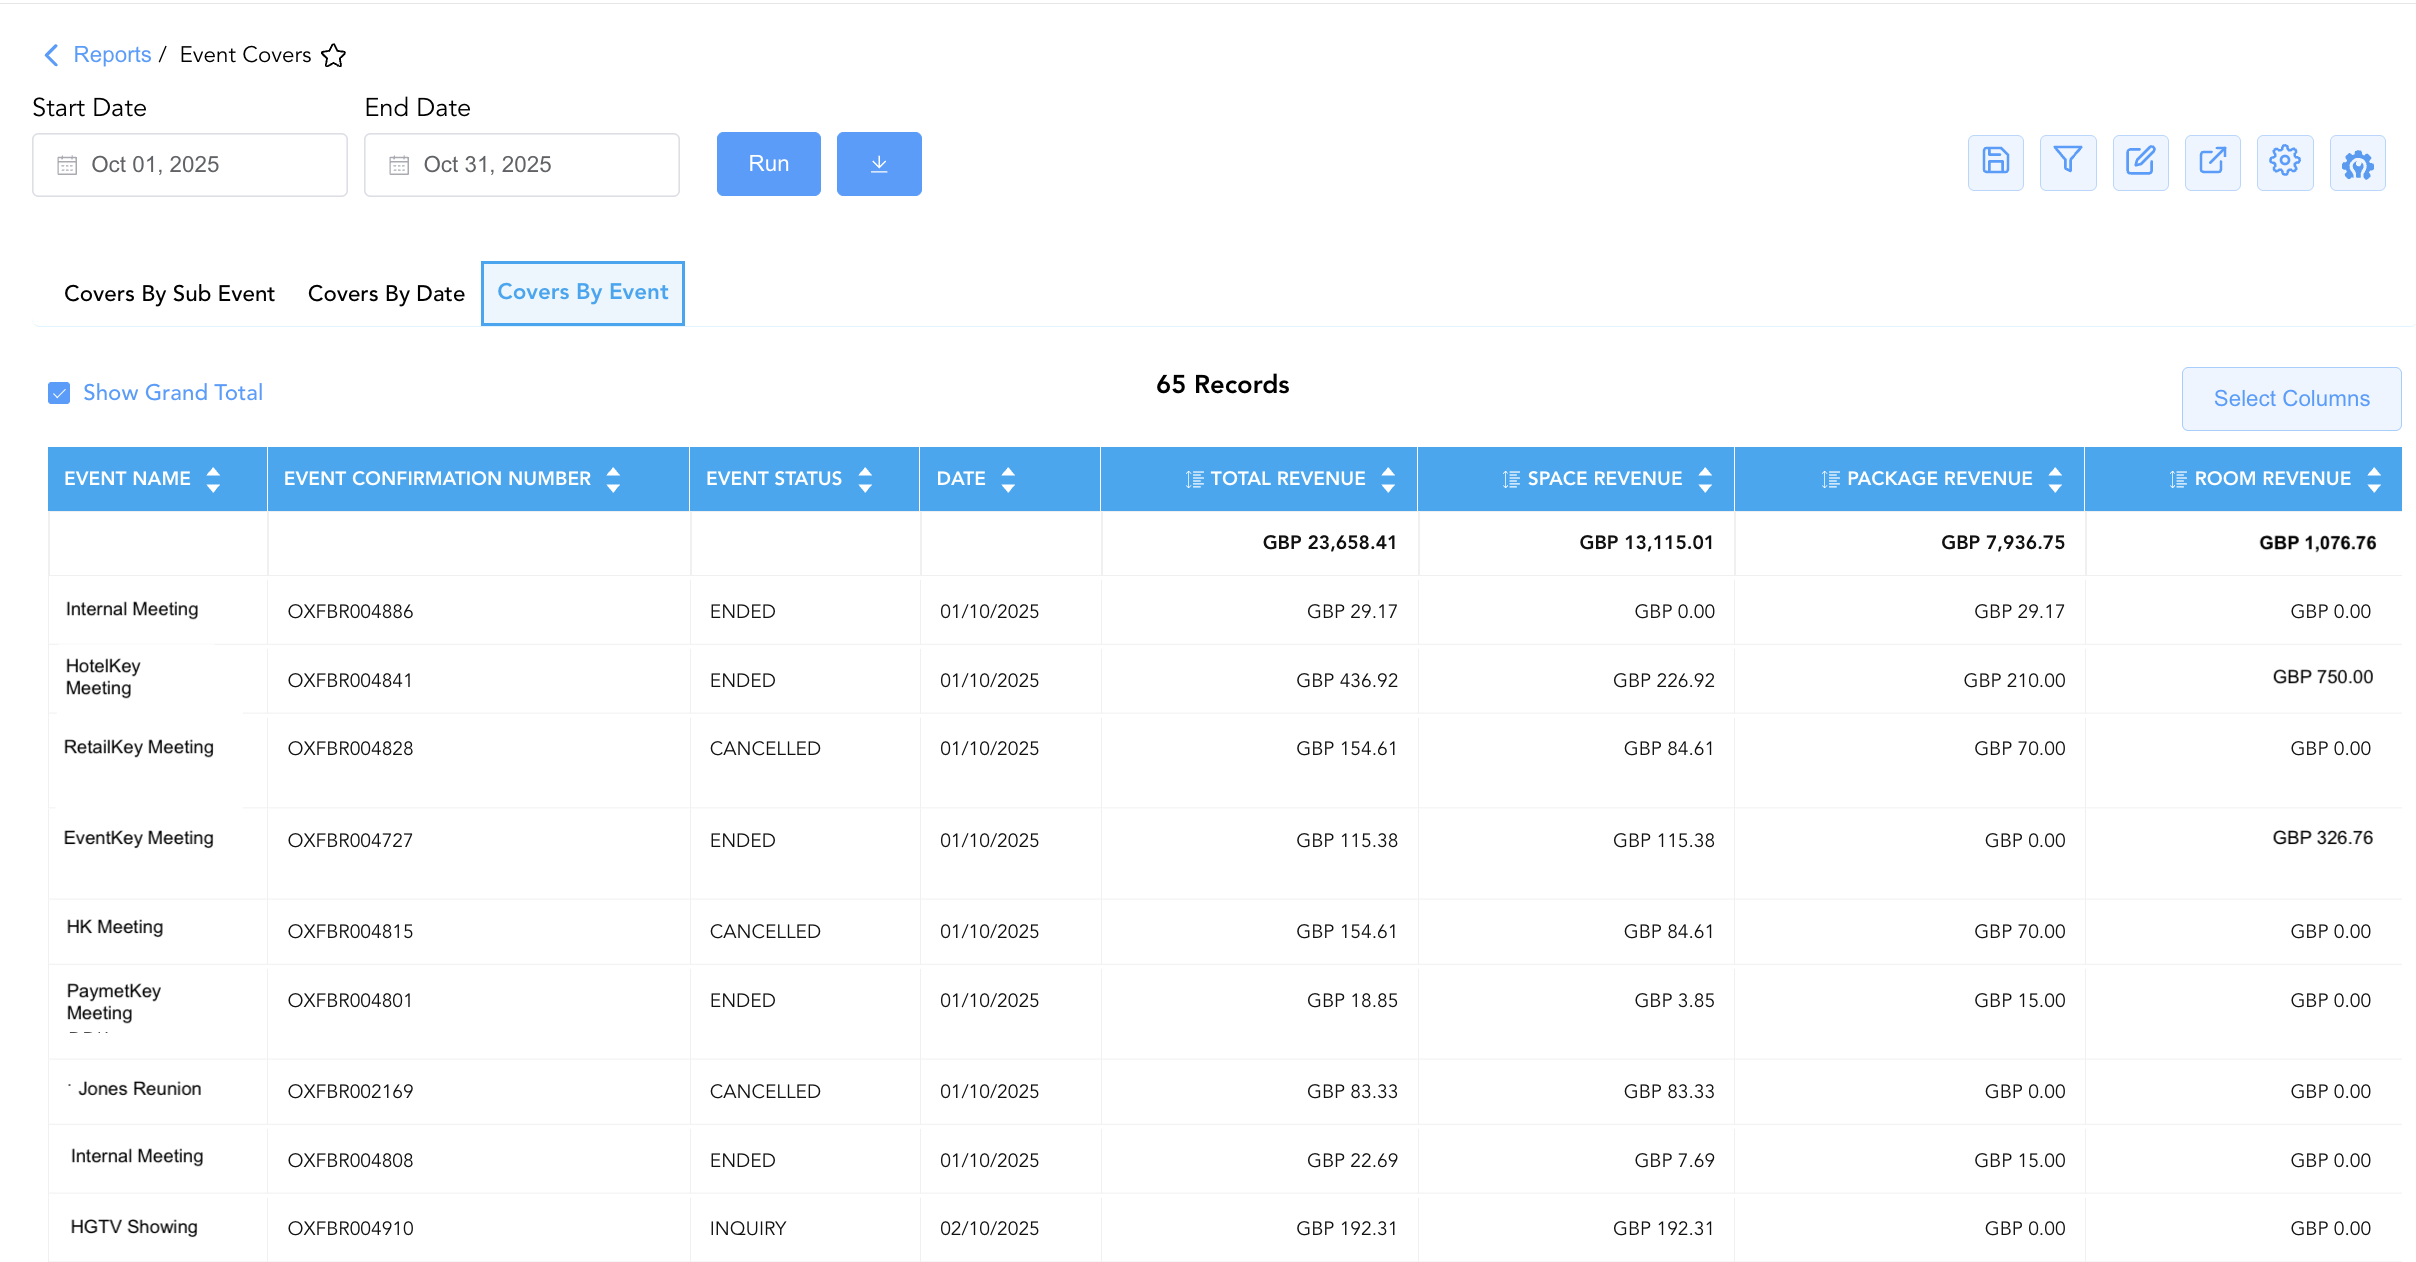
3. Covers By Event Section (Master Event Yields)
Audits master event contracts, detailing execution dates, event statuses, confirmation numbers, master event names, space rental earnings, package revenues, attached room block lodging revenues, and total net financial yields.
-
Primary Use: Evaluating overall master event profitability across both catering functions and attached guest room blocks, auditing cancelled event losses, and reviewing master client value.
-
Key Metrics: Date, Event Status, Event Confirmation Number, Event Name, Space Revenue, Package Revenue, Room Revenue, Total Revenue.
Data Dictionary (Dynamic View Columns)
Customize your default view using the Configure (⚙️) icon on the report page. Below is the full data dictionary representing all 17 exact dynamic columns available across the 3 report sections, sorted in alphabetical order by column name:
💰 Financial Posting Logic: Figures in
Space Revenue,Package Revenue,Total Group Block Revenue,Room Revenue, andTotal Revenuereflect net charges posted for event functions or attached room blocks.Total Revenueis dynamically calculated as (Space Revenue + Package Revenue + Room Revenue).
|
Column Name |
Section Applicability |
Description |
Data Source / System Mapping |
Includes Taxes & Fees? |
|
Date |
All Sections |
Calendar date on which the event, sub-event, or catering function occurs. |
Event Calendar > Function Date |
N/A |
|
Event Classification |
Sections 1, 2 |
Classification category or purpose code assigned to the event (e.g., |
Event Master > Classification Code |
N/A |
|
Event Confirmation Number |
Sections 1, 3 |
Primary unique alphanumeric confirmation ID assigned to the master event in EventKey (e.g., |
Event Master > Confirmation ID |
N/A |
|
Event Name |
Section 3 |
Official descriptive title or commercial name of the master event. |
Event Master > Event Title |
N/A |
|
Event Status |
Sections 1, 3 |
Operational lifecycle state of the event or sub-event (e.g., |
Event Master > Lifecycle Status |
N/A |
|
Package Revenue |
All Sections |
Total net revenue generated from bundled catering packages. |
Event Ledger > Package Revenue |
❌ No |
|
Room Revenue |
Section 3 |
Total net lodging revenue generated from attached guest room blocks. |
Group Ledger > Room Revenue |
❌ No |
|
Space Revenue |
All Sections |
Total net rental revenue generated from function room and meeting space rentals. |
Event Ledger > Space Rental |
❌ No |
|
Sub Event End Time |
Section 1 |
Scheduled completion timestamp for a specific sub-event function. |
Sub-Event Schedule > End Time |
N/A |
|
Sub Event Name |
Section 1 |
Official descriptive name or function title of the sub-event. |
Sub-Event Schedule > Function Name |
N/A |
|
Sub Event Start Time |
Section 1 |
Scheduled commencement timestamp for a specific sub-event function. |
Sub-Event Schedule > Start Time |
N/A |
|
Total Actual |
Section 1 |
Physical count of guest covers actually served during the sub-event function. |
Event Engine > Actual Headcount |
N/A |
|
Total Covers |
Section 2 |
Aggregated daily count of guest covers served across all event functions on the target date. |
SUM(Actual Headcount) |
N/A |
|
Total Expected |
Section 1 |
Anticipated guest cover headcount planned for catering preparation and seating setup. |
Event Master > Expected Covers |
N/A |
|
Total Group Block Revenue |
Section 2 |
Total net lodging revenue generated from associated group room blocks on the target date. |
Group Ledger > Daily Block Yield |
❌ No |
|
Total Guaranteed |
Section 1 |
Final minimum guest cover headcount guaranteed by the client for catering billing purposes. |
Event Master > Guaranteed Covers |
N/A |
|
Total Revenue |
All Sections |
Total net financial yield generated combining space, package, and attached lodging revenues (Space Revenue + Package Revenue + Room Revenue). |
Calculated: Net Total Event Yield |
❌ No |
Customization & Platform Features
User & Property Preferences
-
Personal Preference: Tailor your individual view by hiding or dragging columns. Your preferences save automatically for future sessions.
-
Property Defaults: System Admins can configure standard default layouts across all property users to streamline operational reporting. To maximize audit efficiency, group the columns into the below logical blocks:
-
Section 1: Covers By Sub Event
-
-
Sub-Event Identity & Primary Locators (Cols 1–4):
Sub Event Name|Event Confirmation Number|Event Status|Event Classification -
Execution Schedule Window (Cols 5–7):
Date|Sub Event Start Time|Sub Event End Time -
Cover Attendance Headcount KPIs (Cols 8–10):
Total Actual|Total Guaranteed|Total Expected -
Financial Revenue Stream Breakdown (Cols 11–13):
Total Revenue|Space Revenue|Package Revenue
-
-
-
Section 2: Covers By Date
-
-
Calendar Anchor & Event Classification (Cols 1–2):
Date|Event Classification -
Aggregated Cover Attendance Volume (Col 3):
Total Covers -
Aggregated Financial Revenue Streams (Cols 4–7):
Total Revenue|Space Revenue|Package Revenue|Total Group Block Revenue
-
-
-
Section 3: Covers By Event
-
-
Master Event Identity & Primary Locators (Cols 1–3):
Event Name|Event Confirmation Number|Event Status -
Calendar Anchor (Col 4):
Date -
Financial Revenue Stream Breakdown & Total (Cols 5–8):
Total Revenue|Space Revenue|Package Revenue|Room Revenue
-
-
-
Report Toolbar & Quick Actions
Use the top-right toolbar icons on the report page to manage and export your data view:
|
Icon |
Action / Feature |
Description |

|
Knowledge Article |
Opens the knowledge base article to learn how to interpret this report. |

|
Saved Views |
Saves your column filtering, sorting, and highlight preferences so you can easily reload your custom view later without reconfiguring the report. |

|
Filter |
Opens filter controls to isolate specific data within a column based on your selected criteria. |

|
Highlight |
Highlights column values in a designated color based on selected conditions. |

|
Export |
Exports and downloads the report in various formats (Excel, PDF, CSV) for offline analysis or printing. |

|
Configure |
Opens column selection controls to toggle visibility, reorder columns, or hide rows with all zeros. |

|
Additional Configuration |
Provides advanced report configuration and display formatting options to customize data presentation. |
Advanced Controls
-
Banquet Service & Kitchen Prep Audits: Export Section 1 (
Covers By Sub Event) daily to align kitchen food production (Total Expected) with guaranteed banquet covers (Total Guaranteed). -
Cover Variance & Billing Reconciliation: Compare
Total GuaranteedagainstTotal Actualin Section 1 to ensure clients are billed for whichever headcount figure is higher per contract terms. -
Highlighting (Conditional Formatting): Apply custom rules to automatically highlight high-volume cover events (
Total Guaranteed > 100), unconfirmed functions (Event Status = INQUIRY), or top-revenue catering dates.
🔗 Related Reports & Next Steps
Within 🤝 Sales, Groups & Events Reports & 🥂 Event Management (EventKey):
-
All Events Report – Two-section master event summary and sub-event execution log.
-
Event Books Report – Three-section catering sales audit tracking status-based yields, sub-event revenues, and attached room blocks.
-
Event Cancellation Reason Code Report – Two-section audit tracking root causes and staff logs for cancelled catering events.
-
Event Commission Report – Travel agency commission audit tracking commissionable event revenues and payouts.
-
Event Contact Summary Report – Two-section client contact summary and lead inquiry channel performance report.
-
Event Contracts Report – Event contract and BEO signature workflow tracking report.
-
Event Coordinator Productivity Report – Sales manager revenue performance and budget variance audit.
Cross-Pillar Deep Dives:
-
👥 Group Block: Cross-reference attached group block lodging revenues (
Total Group Block Revenue,Room Revenue) with Group Activity Report, Group Reservation Details Report, and Group Pickup Details Report. -
📊 Financial & Food & Beverage Management: Reconcile total catering event revenues (
Total Revenue) with monthly Trial Balance Report and banquet food & beverage cost accounting systems.