
📆 Revision Date:
The new Inquiry Source Report helps you understand exactly where your inquiries are coming from and which channels deliver the greatest impact. By tracking inquiries across sources such as websites, social media, referrals, and marketing campaigns, this report provides clear insight into lead volume, conversion progress, and revenue contribution.
With detailed columns for Origin, Number of Leads, Status, Converted Inquiries, and Revenue, teams can easily evaluate source performance, measure conversion effectiveness, and identify the most profitable channels driving your sales and catering business.
Report Date Range: This report can render the data for up to 365 days in the past or future.
Event Inquiry Source Report
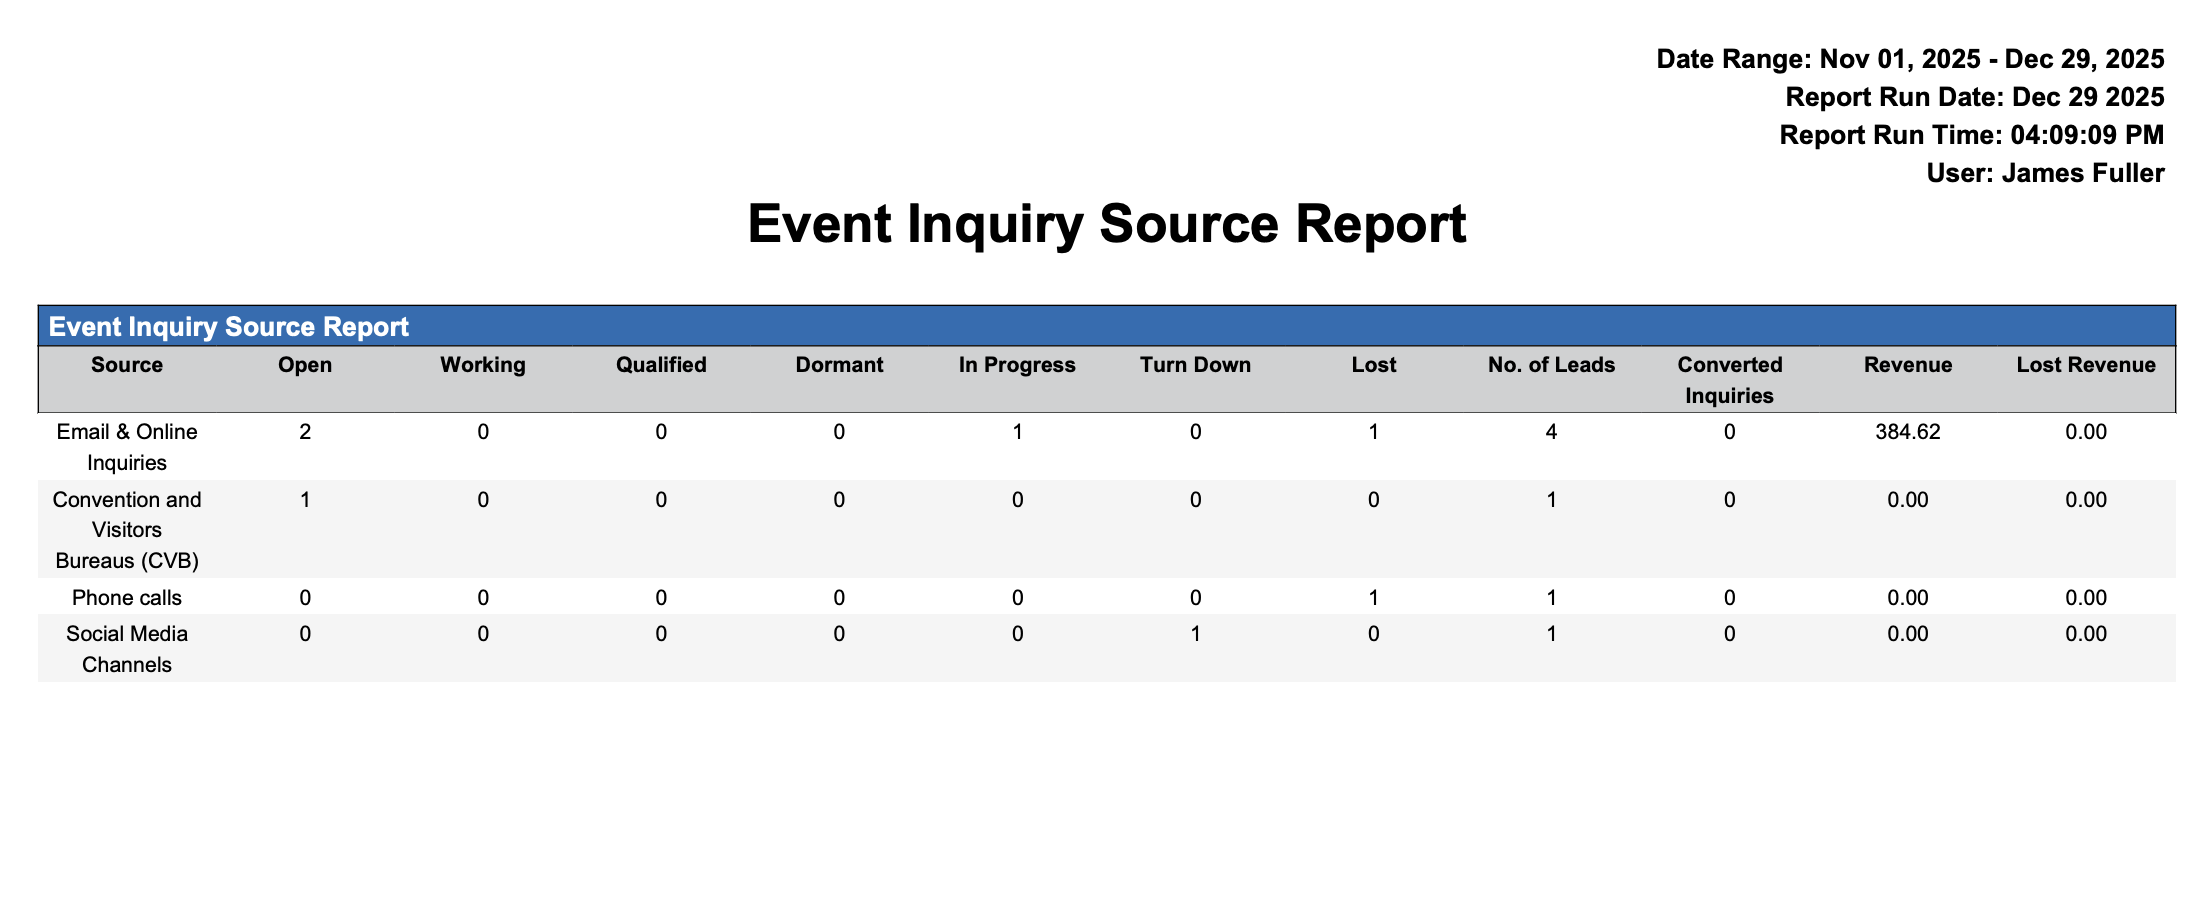
Event Inquiry Source Report – Dynamic View Overview
The Event Inquiry Source Report (Dynamic View) includes 12 columns of data. Users can customize the view by repositioning or hiding columns using the Configure (⚙️) icon located on the report page.
Below is a list of all available column names along with their descriptions.
|
Column Name |
Column Description |
Amount Includes Taxes and Fees |
Amount Calculation or Source of Data |
|
Converted Inquiries |
Converted Inquiries are inquiries that successfully move through the sales process and result in a prospect event, reflecting effective lead follow-up and sales performance. |
|
Total Converted Inquiries = Count of inquiries with a Converted status where the conversion date falls within the selected reporting period.
|
|
Dormant |
Dormant inquiries are inactive leads with no current follow-up or engagement. These inquiries remain in the system for reference and potential reactivation. |
|
Total Dormant Inquiries = Count of inquiries with a Dormant status where the date falls within the selected reporting period.
|
|
In Progress |
In Progress indicates inquiries that are actively being worked and are currently moving through the sales process, but have not yet been converted or closed. |
|
In Progress Inquiries =
|
|
Lost |
Lost inquiries refers to potential inquiries that did not materialize — meaning a lead or opportunity that was pursued but ultimately did not convert into a prospect event. Note: Lost business is defined as an inquiry or event with a cancelled status. |
|
Total Lost Inquiries = Count of inquiries with a Lost status where the date falls within the selected reporting period.
|
|
Lost Revenue |
Lost Revenue represents the estimated revenue associated with inquiries or events that did not convert into a prospect booking. This reflects potential revenue that was not realized during the reporting period. |
|
Lost Revenue =
|
|
No. of Leads |
No. of Leads represents the total count of event inquiries received from a specific source during the selected reporting period. |
|
No. of Leads =
|
|
Open |
Open indicates inquiries that have been received and recorded in the system but have not yet been acted upon or assigned for follow-up. |
|
Open Inquiries =
|
|
Qualified |
Qualified indicates inquiries that have been evaluated and meet the criteria to move forward in the sales process, representing viable sales opportunities. |
|
Qualified Inquiries =
|
|
Revenue |
Revenue represents the total value of confirmed bookings or converted inquiries associated with each inquiry source during the defined reporting period. |
|
Revenue =
|
|
Source |
Source identifies the origin of each inquiry, showing where the lead was generated—such as a website, referral, social media, or marketing campaign. |
|
Source =
|
|
Turn Down |
Turn Down indicates inquiries that were actively declined or rejected by the sales and catering team, meaning the opportunity will not move forward in the sales process. |
|
Turn Down Inquiries =
|
|
Working |
Working indicates inquiries that are actively being engaged by the sales and catering team but have not yet reached a final outcome, such as conversion, turn down, or dormancy. |
|
Working Inquiries =
|
Miscellaneous Report Information
Available Features:
-
Export
Allows you to download and save the report in different file formats (e.g., Excel, PDF) for offline use or sharing. -
Filter
Enables you to narrow down the data by applying criteria you define, so you can focus on specific information. -
Highlight (Conditional Formatting)
Automatically highlights certain values based on rules you set, making key data easier to spot at a glance.
Available Configuration:
-
User Preferences
Customize your personal report view by rearranging, showing, or hiding columns according to your needs. -
Property Preferences
Configure the default report layout for all users at the property level by repositioning or disabling columns to streamline the view.
Baseline Configuration:
-
Property Preferences Settings
The following columns will be disabled for the initial deployment:
Not Applicable