
Event Space Occupancy Report Overview
Parent Hub: 🤝 Sales, Groups & Events Reports
Category: 🥂 Event Management (EventKey)
Target Roles: Catering & Event Directors, Banquet Operations Managers, Directors of Sales, Revenue Managers, Facility Planners, General Managers
Key Value: Evaluate function room and ballroom utilization across time periods, analyze space demand by event classification, audit cancellation and vacancy counts, track macro space usage totals, and optimize meeting space pricing and yield strategies.
Date Parameter: Date Range Selector (Start & End) | Past & Future | Maximum Window: 366 Days
Executive Summary
The Event Space Occupancy Report is an essential facility scheduling audit, space utilization analysis, and catering operational performance document within the 🥂 Event Management (EventKey) category of the 🤝 Sales, Groups & Events Reports hub. Designed to deliver multi-dimensional visibility over property meeting spaces, banquet halls, boardrooms, and event venues, it aggregates occupied timeframes, cancellation impacts, vacant inventory, and event-type distribution over specified reporting periods.
-
By organizing function space data into 4 defined report sections: Event Space Occupancy, Count Of Spaces By Usage, Usage By Event Type And Spaces, and Usage By Month And Event Type, this report enables event directors, space coordinators, and revenue managers to evaluate space-level utilization (
Event Space Occupancy), macro property space usage counts (Count Of Spaces By Usage), space demand disaggregated by event classification (Usage By Event Type And Spaces), and monthly demand trends by event purpose (Usage By Month And Event Type). It correlates calendar periods (Month,Year) and facility setups (Space Type,Space Name) with operational volume metrics (Occupied,Cancelled,Vacant), event classifications (Event Type, e.g., Convention/Congress, Course/Training, Leisure Event, Small Meeting), and utilization counts (Usage).
Key Capabilities
-
Four-Section Multi-Tier Space Utilization Audit: Organizes function room performance into space-level monthly tracking, aggregate property space counters, space utilization by event type, and monthly event-type demand distributions.
-
Space Category & Facility Type Oversight: Disaggregates occupancy across standardized facility categories (
Space Type, e.g.,BOARDROOM,BANQUET,EXPO,MEETING) and physical rooms (Space Name). -
Occupancy, Vacancy & Cancellation Tracking: Measures operational space utilization (
Occupied), vacant unused availability (Vacant), and lost booking opportunities (Cancelled). -
Macro Property Usage Counters: Delivers executive-level counts of total occupied, vacant, and cancelled spaces across the facility within the reporting window (
Count Of Spaces By Usage). -
Demand Correlation by Event Classification: Maps room usage directly to specific event types (
Event Type, e.g., Convention/Congress, Course/Training, Leisure Event, Small Meeting) to evaluate which market segments drive banquet space consumption.
Report Views & Functional Breakdown
The Event Space Occupancy Report presents function space scheduling and utilization data across 4 defined sections:
┌────────────────────────────────────────────────────────────────────────┐
│                    EVENT SPACE OCCUPANCY REPORT                        │
├────────────────────────────────────────────────────────────────────────┤
│                       4 Defined Report Sections                        │
├──────────────────────────┬─────────────────────────────────────────────┤
│ 1. Event Space Occupancy │ 2. Count Of Spaces By Usage                 │
│    (Space-Level Monthly) │    (Macro Property Utilization Totals)      │
├──────────────────────────┼─────────────────────────────────────────────┤
│ 3. Usage By Event Type   │ 4. Usage By Month And Event Type            │
│    And Spaces (Room Fit) │    (Seasonal Demand Distribution)           │
└──────────────────────────┴─────────────────────────────────────────────┘
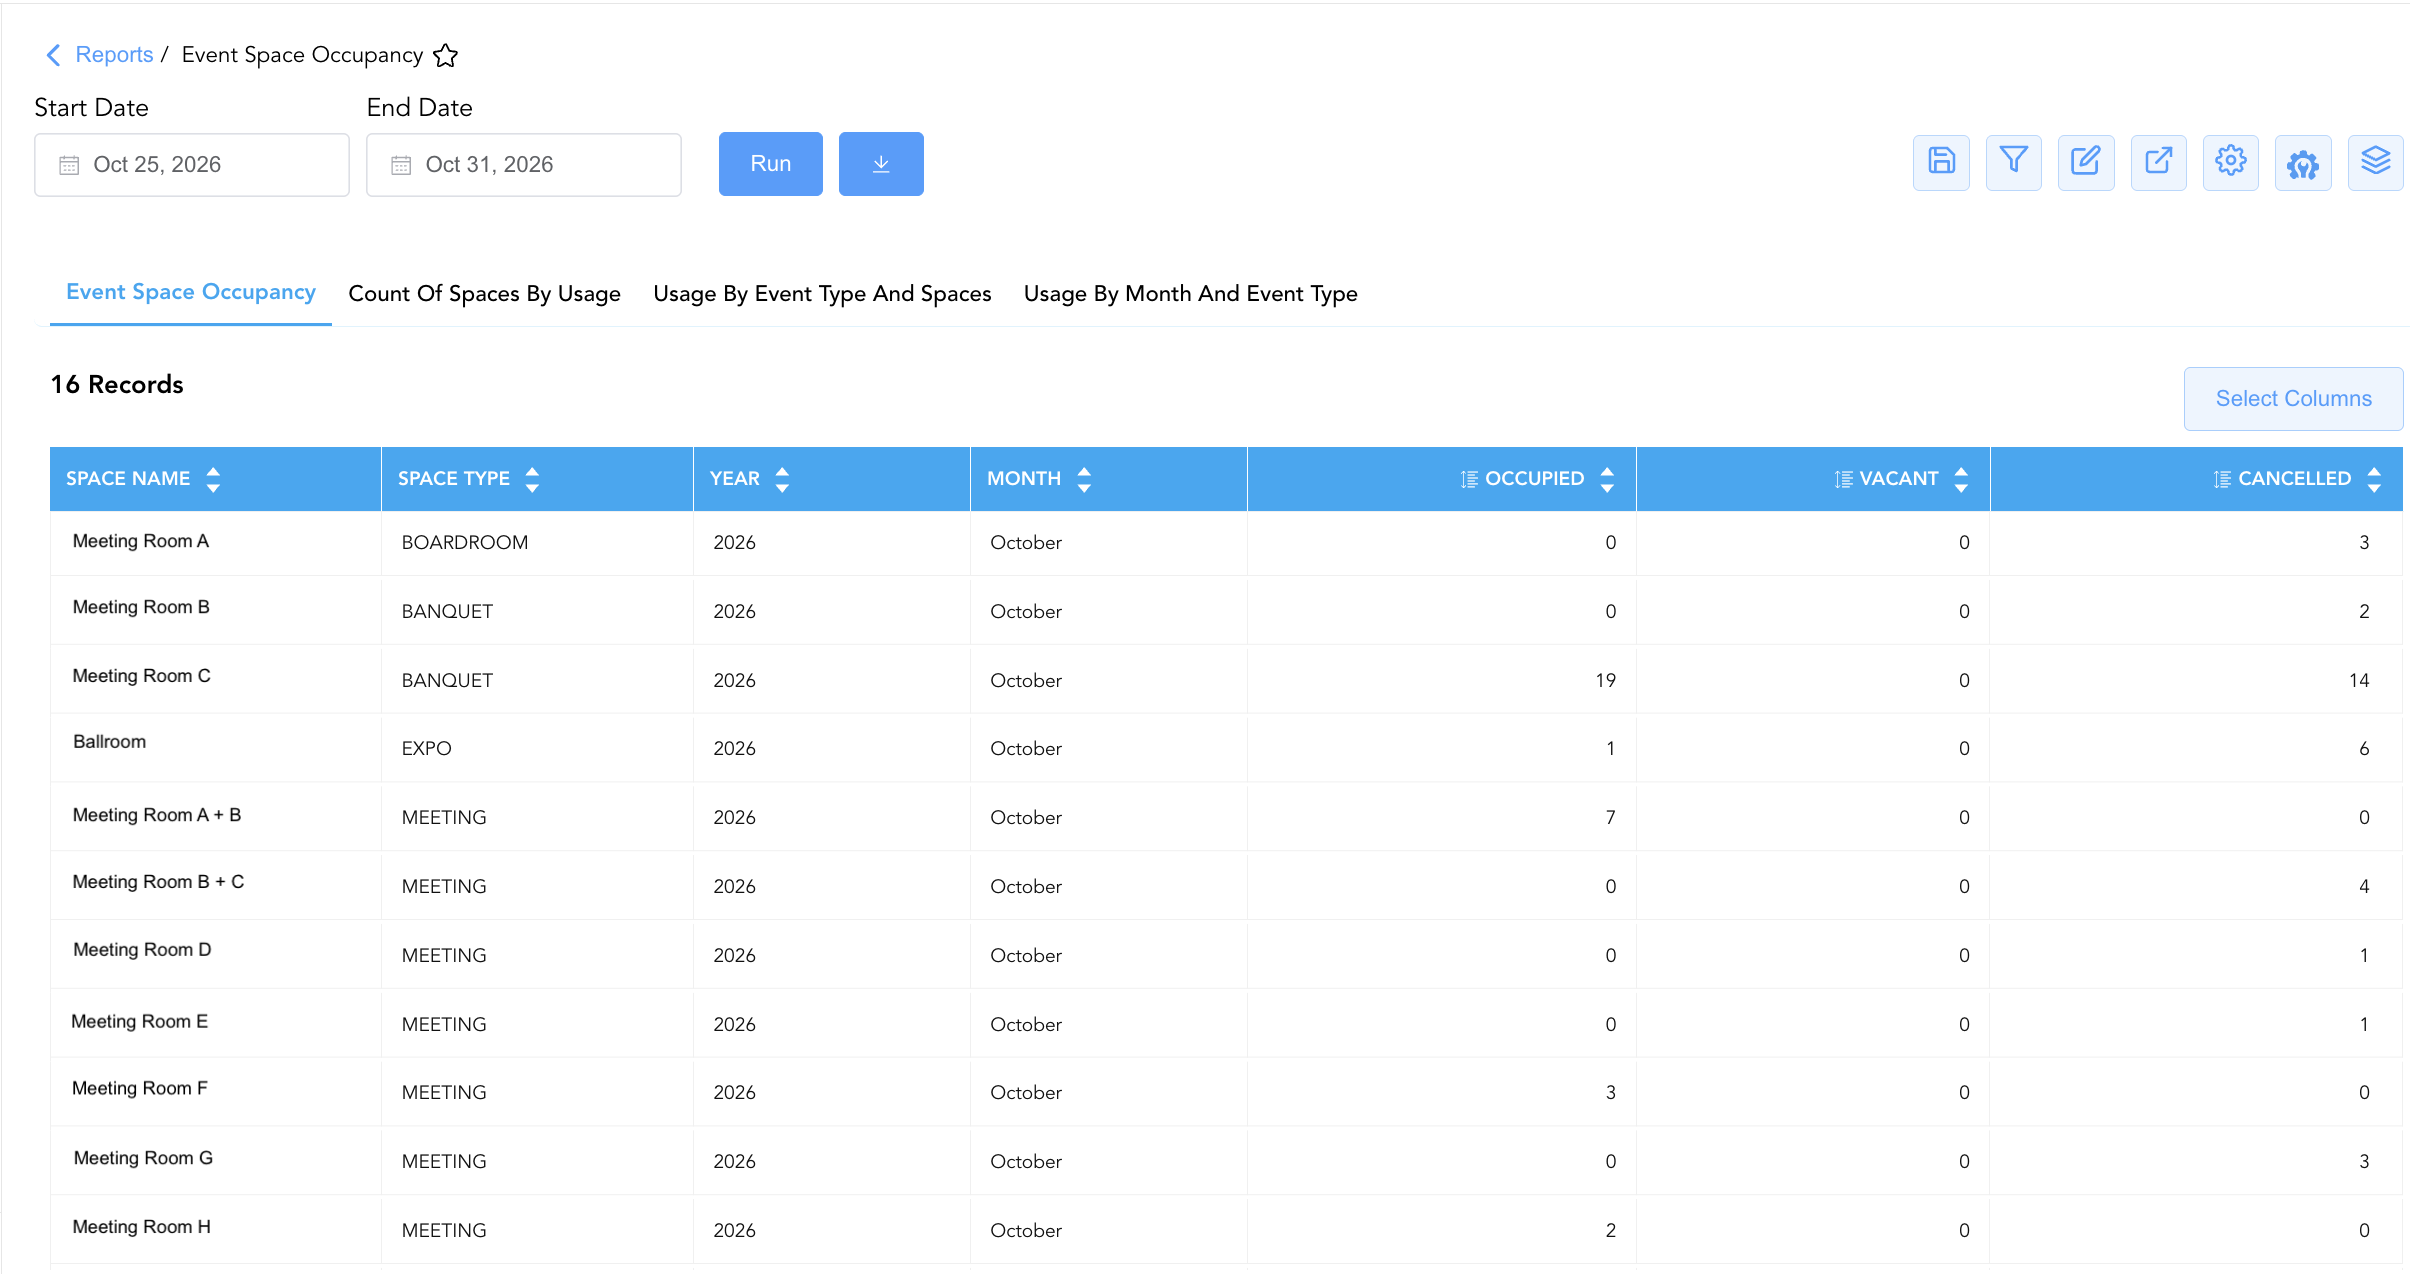
1. Event Space Occupancy Section (Space-Level Monthly Tracking)
Monitors individual function rooms and ballrooms by month and year, detailing space type classifications, occupied session counts, cancellation volumes, and vacant availability counts.
-
Primary Use: Evaluating individual meeting room and ballroom performance, identifying chronically underutilized or vacant spaces, and tracking cancellation impact.
-
Key Metrics: Month, Year, Space Type, Space Name, Occupied, Cancelled, Vacant.
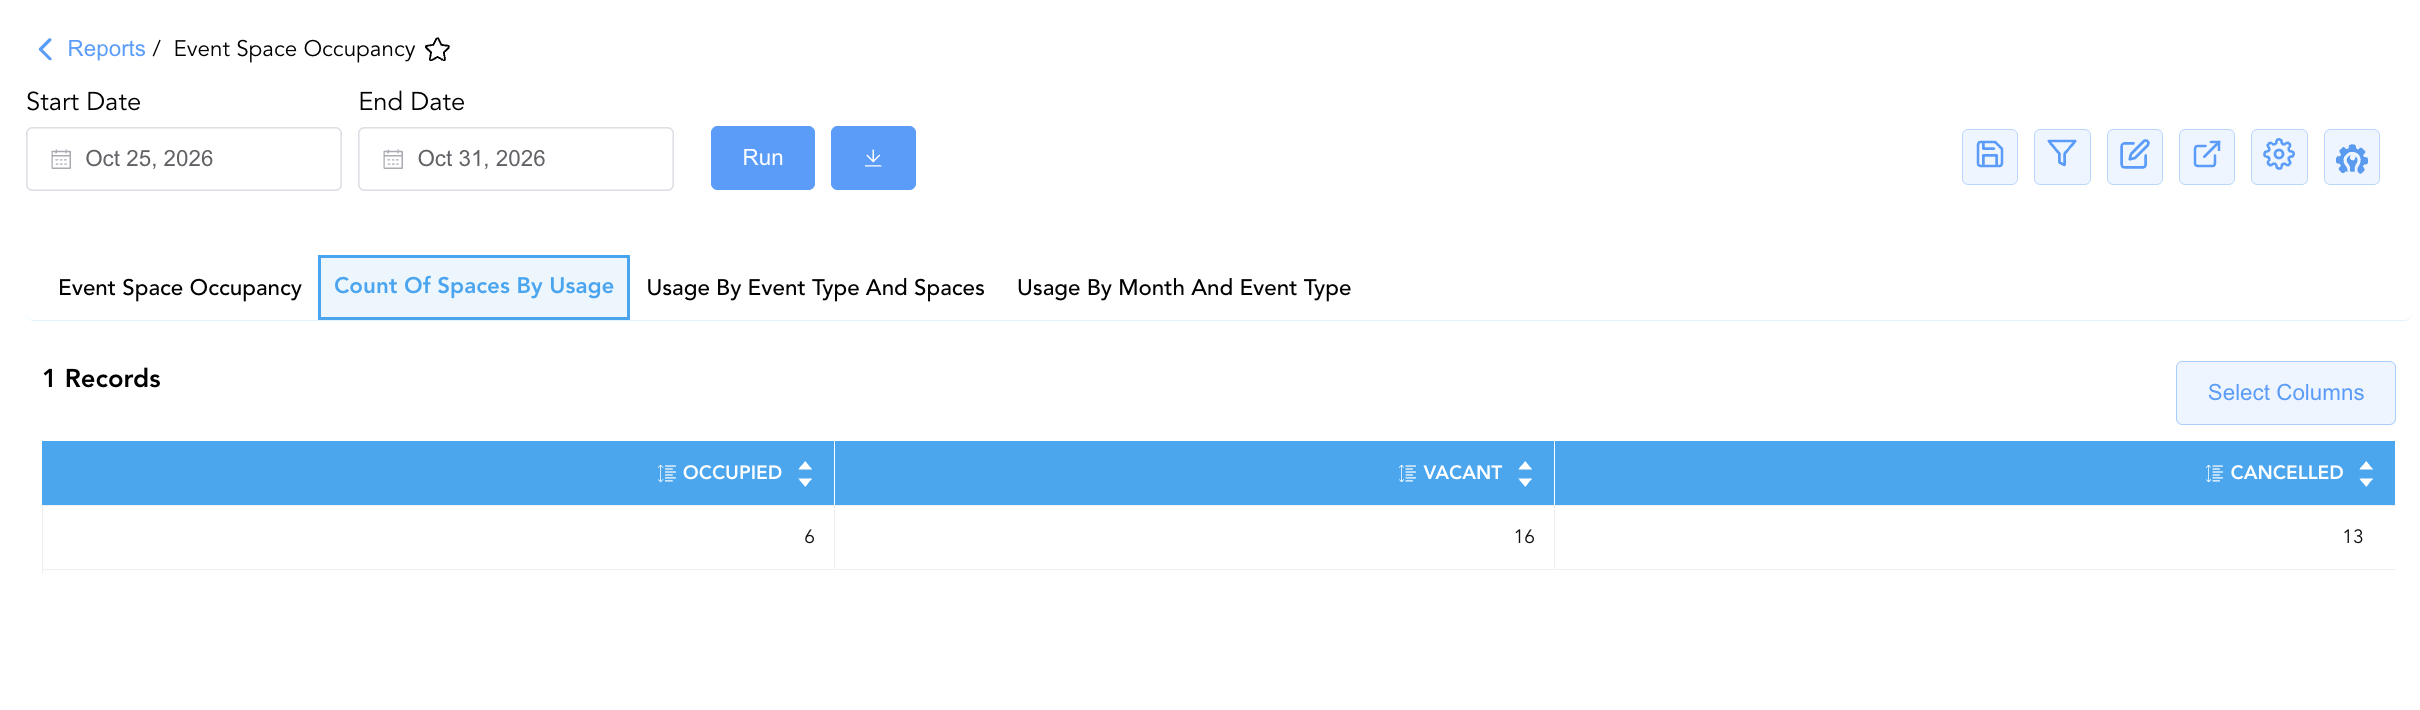
2. Count Of Spaces By Usage Section (Macro Property Utilization Totals)
Consolidates total counts of physical function spaces across the property categorized by their operational utilization status during the reporting period.
-
Primary Use: Providing executive leadership with a quick snapshot of overall facility capacity utilization and unused venue inventory.
-
Key Metrics: Occupied, Vacant, Cancelled.
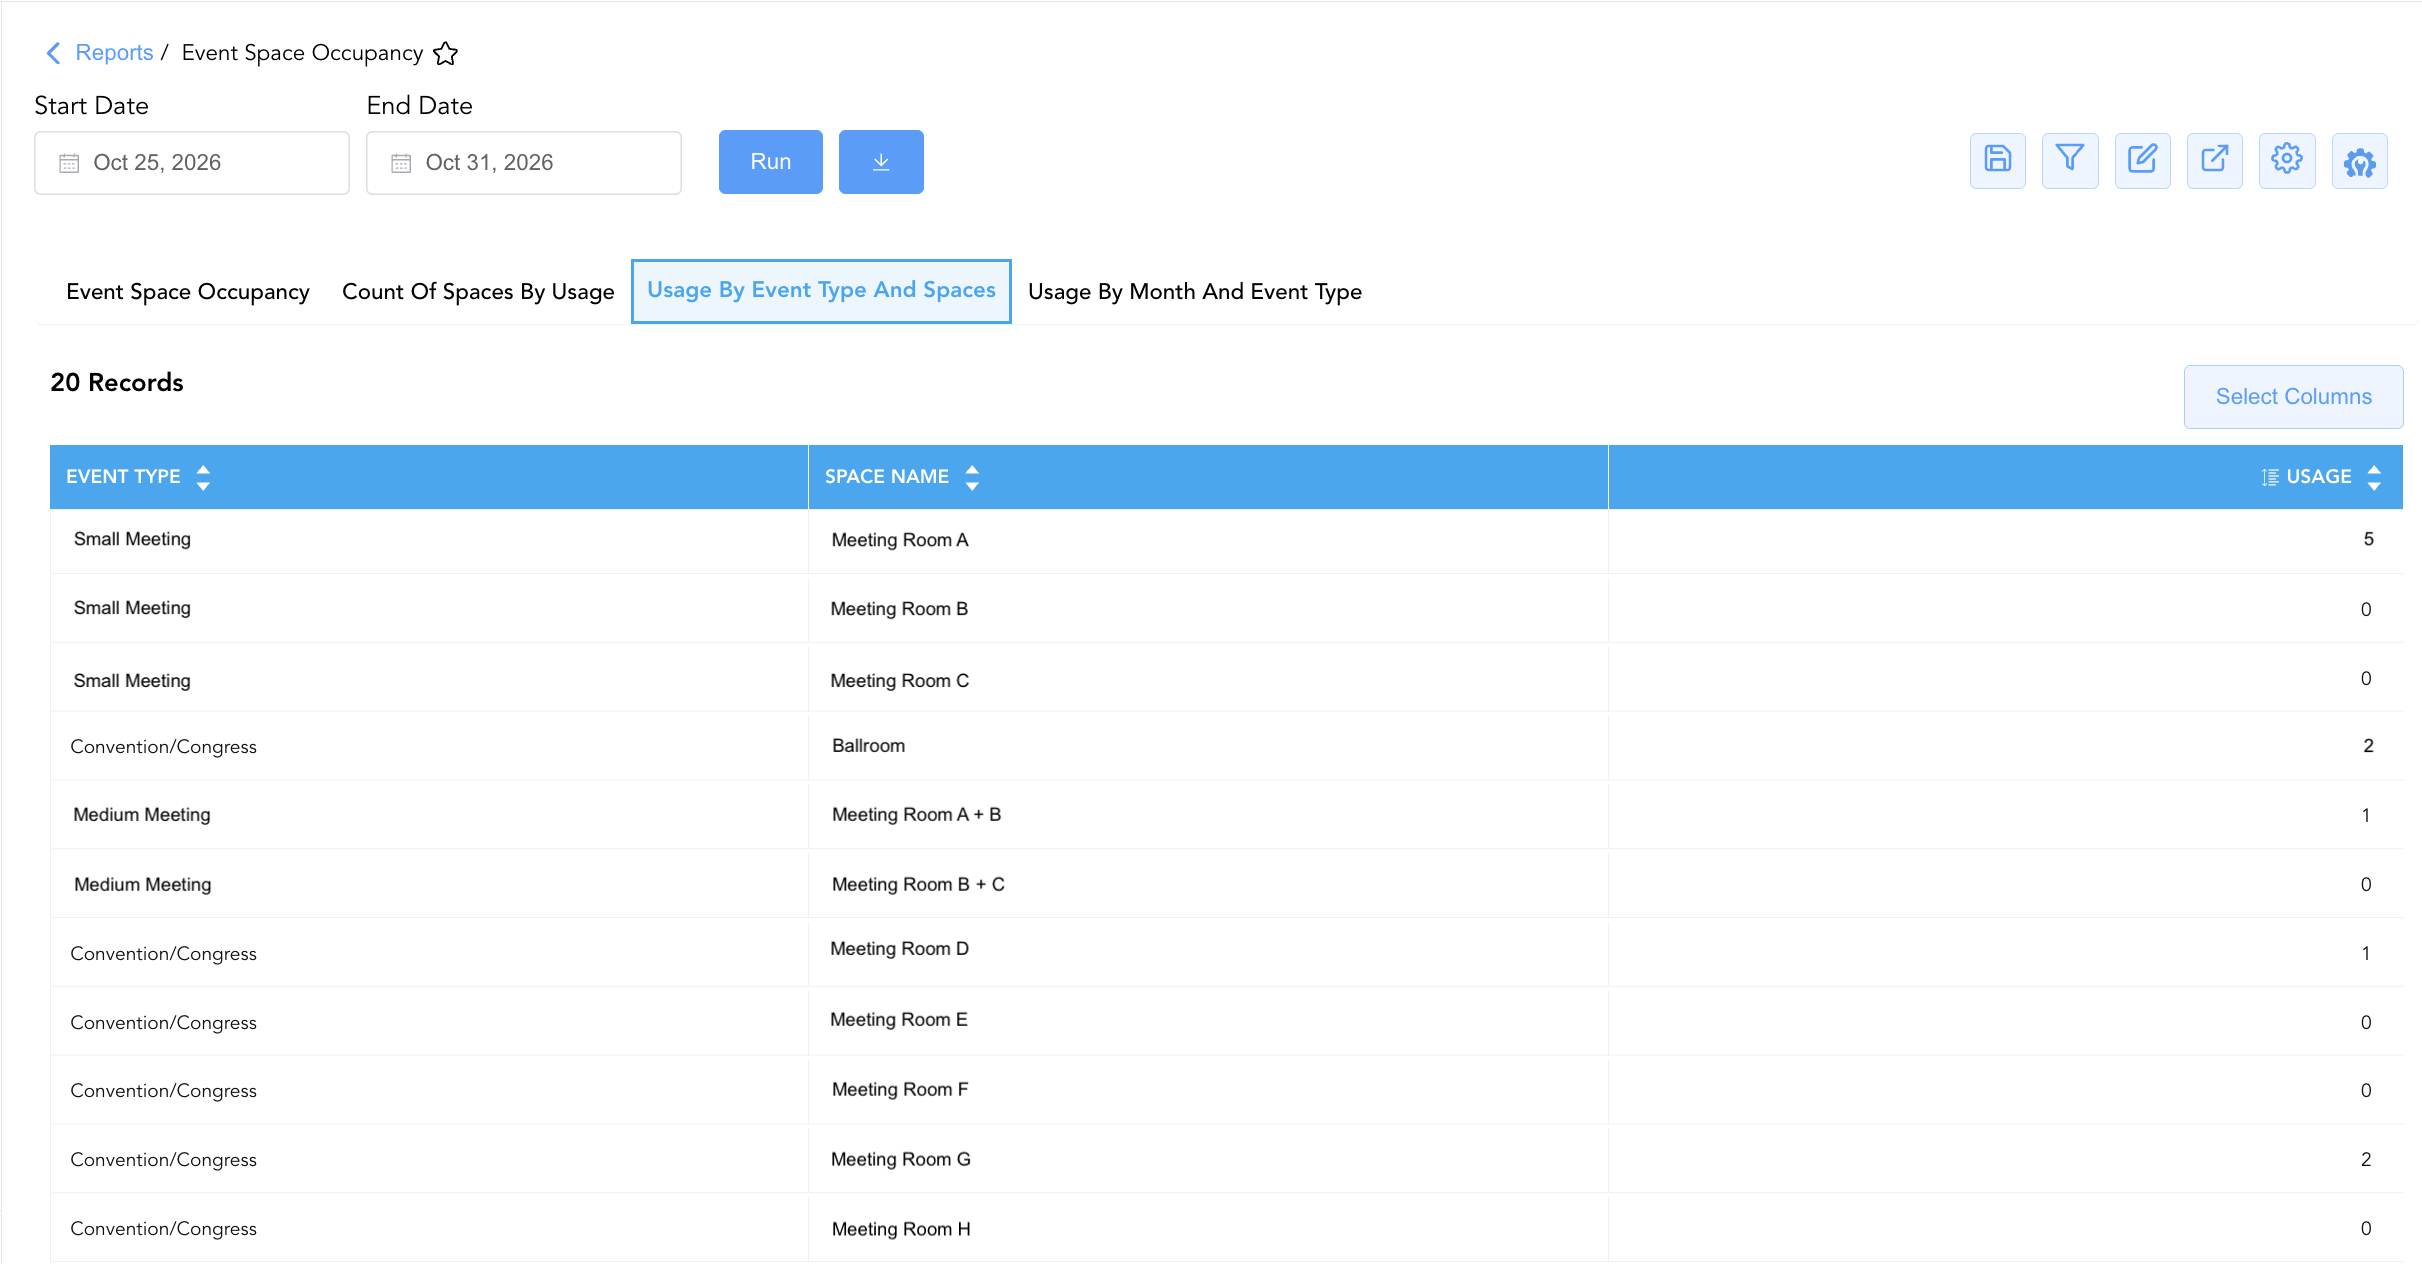
3. Usage By Event Type And Spaces Section (Event-to-Space Alignment)
Cross-tabulates event classifications against physical function rooms to measure exact utilization frequencies.
-
Primary Use: Determining which meeting spaces best accommodate specific event categories (such as banquets vs. corporate conventions) and identifying space layout preferences.
-
Key Metrics: Event Type, Space Name, Usage.
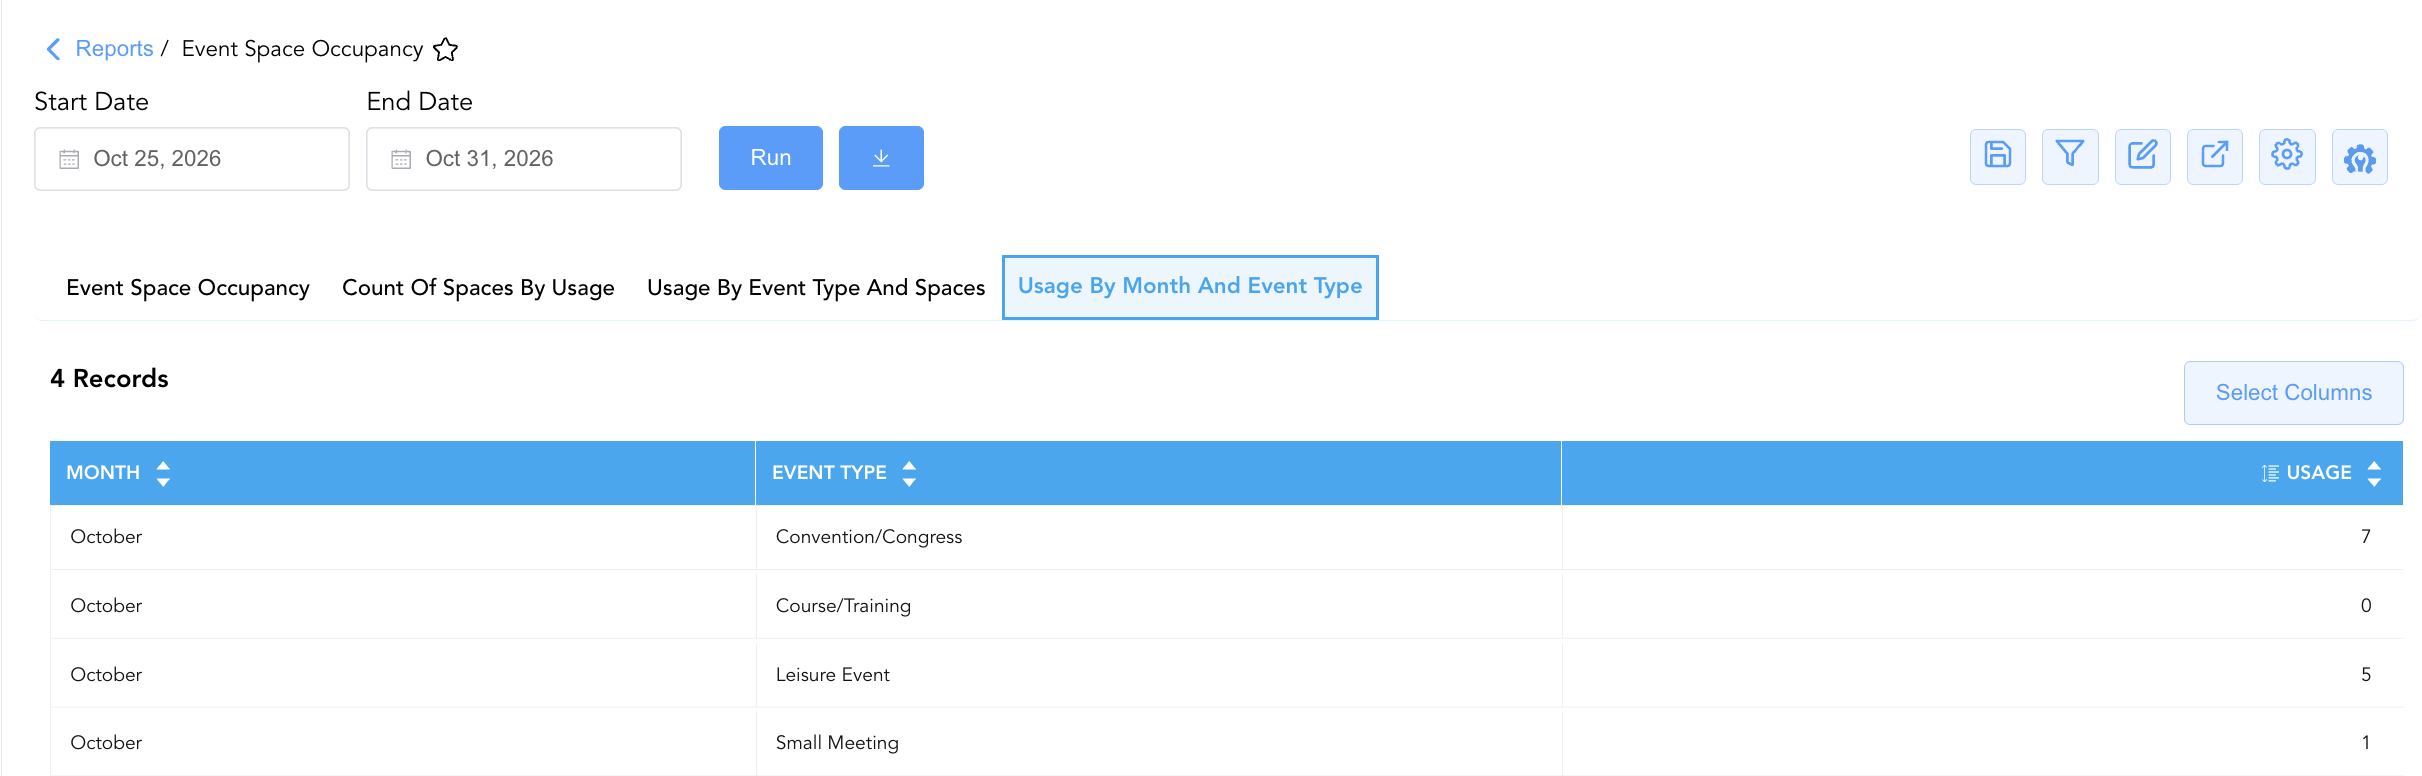
4. Usage By Month And Event Type Section (Seasonal Demand Distribution)
Aggregates event utilization counts grouped by calendar month and event purpose classification.
-
Primary Use: Identifying seasonal demand trends across different meeting categories to guide sales promotional campaigns and banquet pricing strategies.
-
Key Metrics: Month, Event Type, Usage.
Data Dictionary (Dynamic View Columns)
Customize your default view using the Configure (⚙️) icon on the report page. Below is the full data dictionary representing all 9 exact dynamic columns available across the 4 report sections, sorted in alphabetical order by column name:
|
Column Name |
Section Applicability |
Description |
Data Source / System Mapping |
Includes Taxes & Fees? |
|
Cancelled |
Sections 1, 2 |
Count of event sessions cancelled for the specific space (Section 1) or total count of spaces impacted by cancellations across the property (Section 2). |
Event Master > Cancelled Session Count |
N/A |
|
Event Type |
Sections 3, 4 |
Standardized event purpose category or classification (e.g., |
Event Master > Category Classification |
N/A |
|
Month |
Sections 1, 4 |
Calendar month during which function space occupancy and event usage took place (e.g., |
Event Calendar > Execution Month |
N/A |
|
Occupied |
Sections 1, 2 |
Count of active event sessions hosted in the specific space (Section 1) or total count of spaces actively utilized across the property (Section 2). |
Event Schedule > Occupied Session Count |
N/A |
|
Space Name |
Sections 1, 3 |
Official descriptive name or commercial identifier of the function room, ballroom, lounge, or outdoor venue (e.g., |
Facility Master > Space Description |
N/A |
|
Space Type |
Section 1 |
Operational category or architectural layout type assigned to the facility (e.g., |
Facility Master > Room Type Code |
N/A |
|
Usage |
Sections 3, 4 |
Total numerical count of event functions utilized for the specified space and event type (Section 3) or month and event type (Section 4). |
Event Engine > Event Function Count |
N/A |
|
Vacant |
Sections 1, 2 |
Count of unbooked or available session slots for the specific space (Section 1) or total count of fully vacant spaces across the property (Section 2). |
Event Calendar > Unallocated Session Count |
N/A |
|
Year |
Section 1 |
Four-digit calendar year corresponding to the reporting period (e.g., |
Event Calendar > Execution Year |
N/A |
Customization & Platform Features
User & Property Preferences
-
Personal Preference: Tailor your individual view by hiding or dragging columns. Your preferences save automatically for future sessions.
-
Property Defaults: System Admins can configure standard default layouts across all property users to streamline operational reporting. To maximize audit efficiency, group the columns into the below logical blocks:
-
Section 1: Event Space Occupancy
-
Physical Space Locators & Classification (Cols 1–2):
Space Name|Space Type -
Calendar Period Anchors (Cols 3–4):
Year|Month -
Inventory Utilization & Occupancy KPIs (Cols 5–7):
Occupied|Vacant|Cancelled
-
-
Section 2: Count Of Spaces By Usage
-
Space Inventory Usage Status Breakdown (Cols 1–3):
Occupied|Vacant|Cancelled
-
-
Section 3: Usage By Event Type And Spaces
-
Event Classification & Physical Space Locator (Cols 1–2):
Event Type|Space Name -
Demand Volume KPI (Col 3):
Usage
-
-
Section 4: Usage By Month And Event Type
-
Calendar Period & Event Classification (Cols 1–2):
Month|Event Type -
Monthly Demand Volume KPI (Col 3):
Usage
-
-
Report Toolbar & Quick Actions
Use the top-right toolbar icons on the report page to manage and export your data view:
|
Icon |
Action / Feature |
Description |

|
Knowledge Article |
Opens the knowledge base article to learn how to interpret this report. |

|
Saved Views |
Saves your column filtering, sorting, and highlight preferences so you can easily reload your custom view later without reconfiguring the report. |

|
Filter |
Opens filter controls to isolate specific data within a column based on your selected criteria. |

|
Highlight |
Highlights column values in a designated color based on selected conditions. |

|
Export |
Exports and downloads the report in various formats (Excel, PDF, CSV) for offline analysis or printing. |

|
Configure |
Opens column selection controls to toggle visibility, reorder columns, or hide rows with all zeros. |

|
Additional Configuration |
Provides advanced report configuration and display formatting options to customize data presentation. |

|
Group By |
Summarize and group report data dynamically in real time. |
Interactive Visualizations & Grouping Controls
-
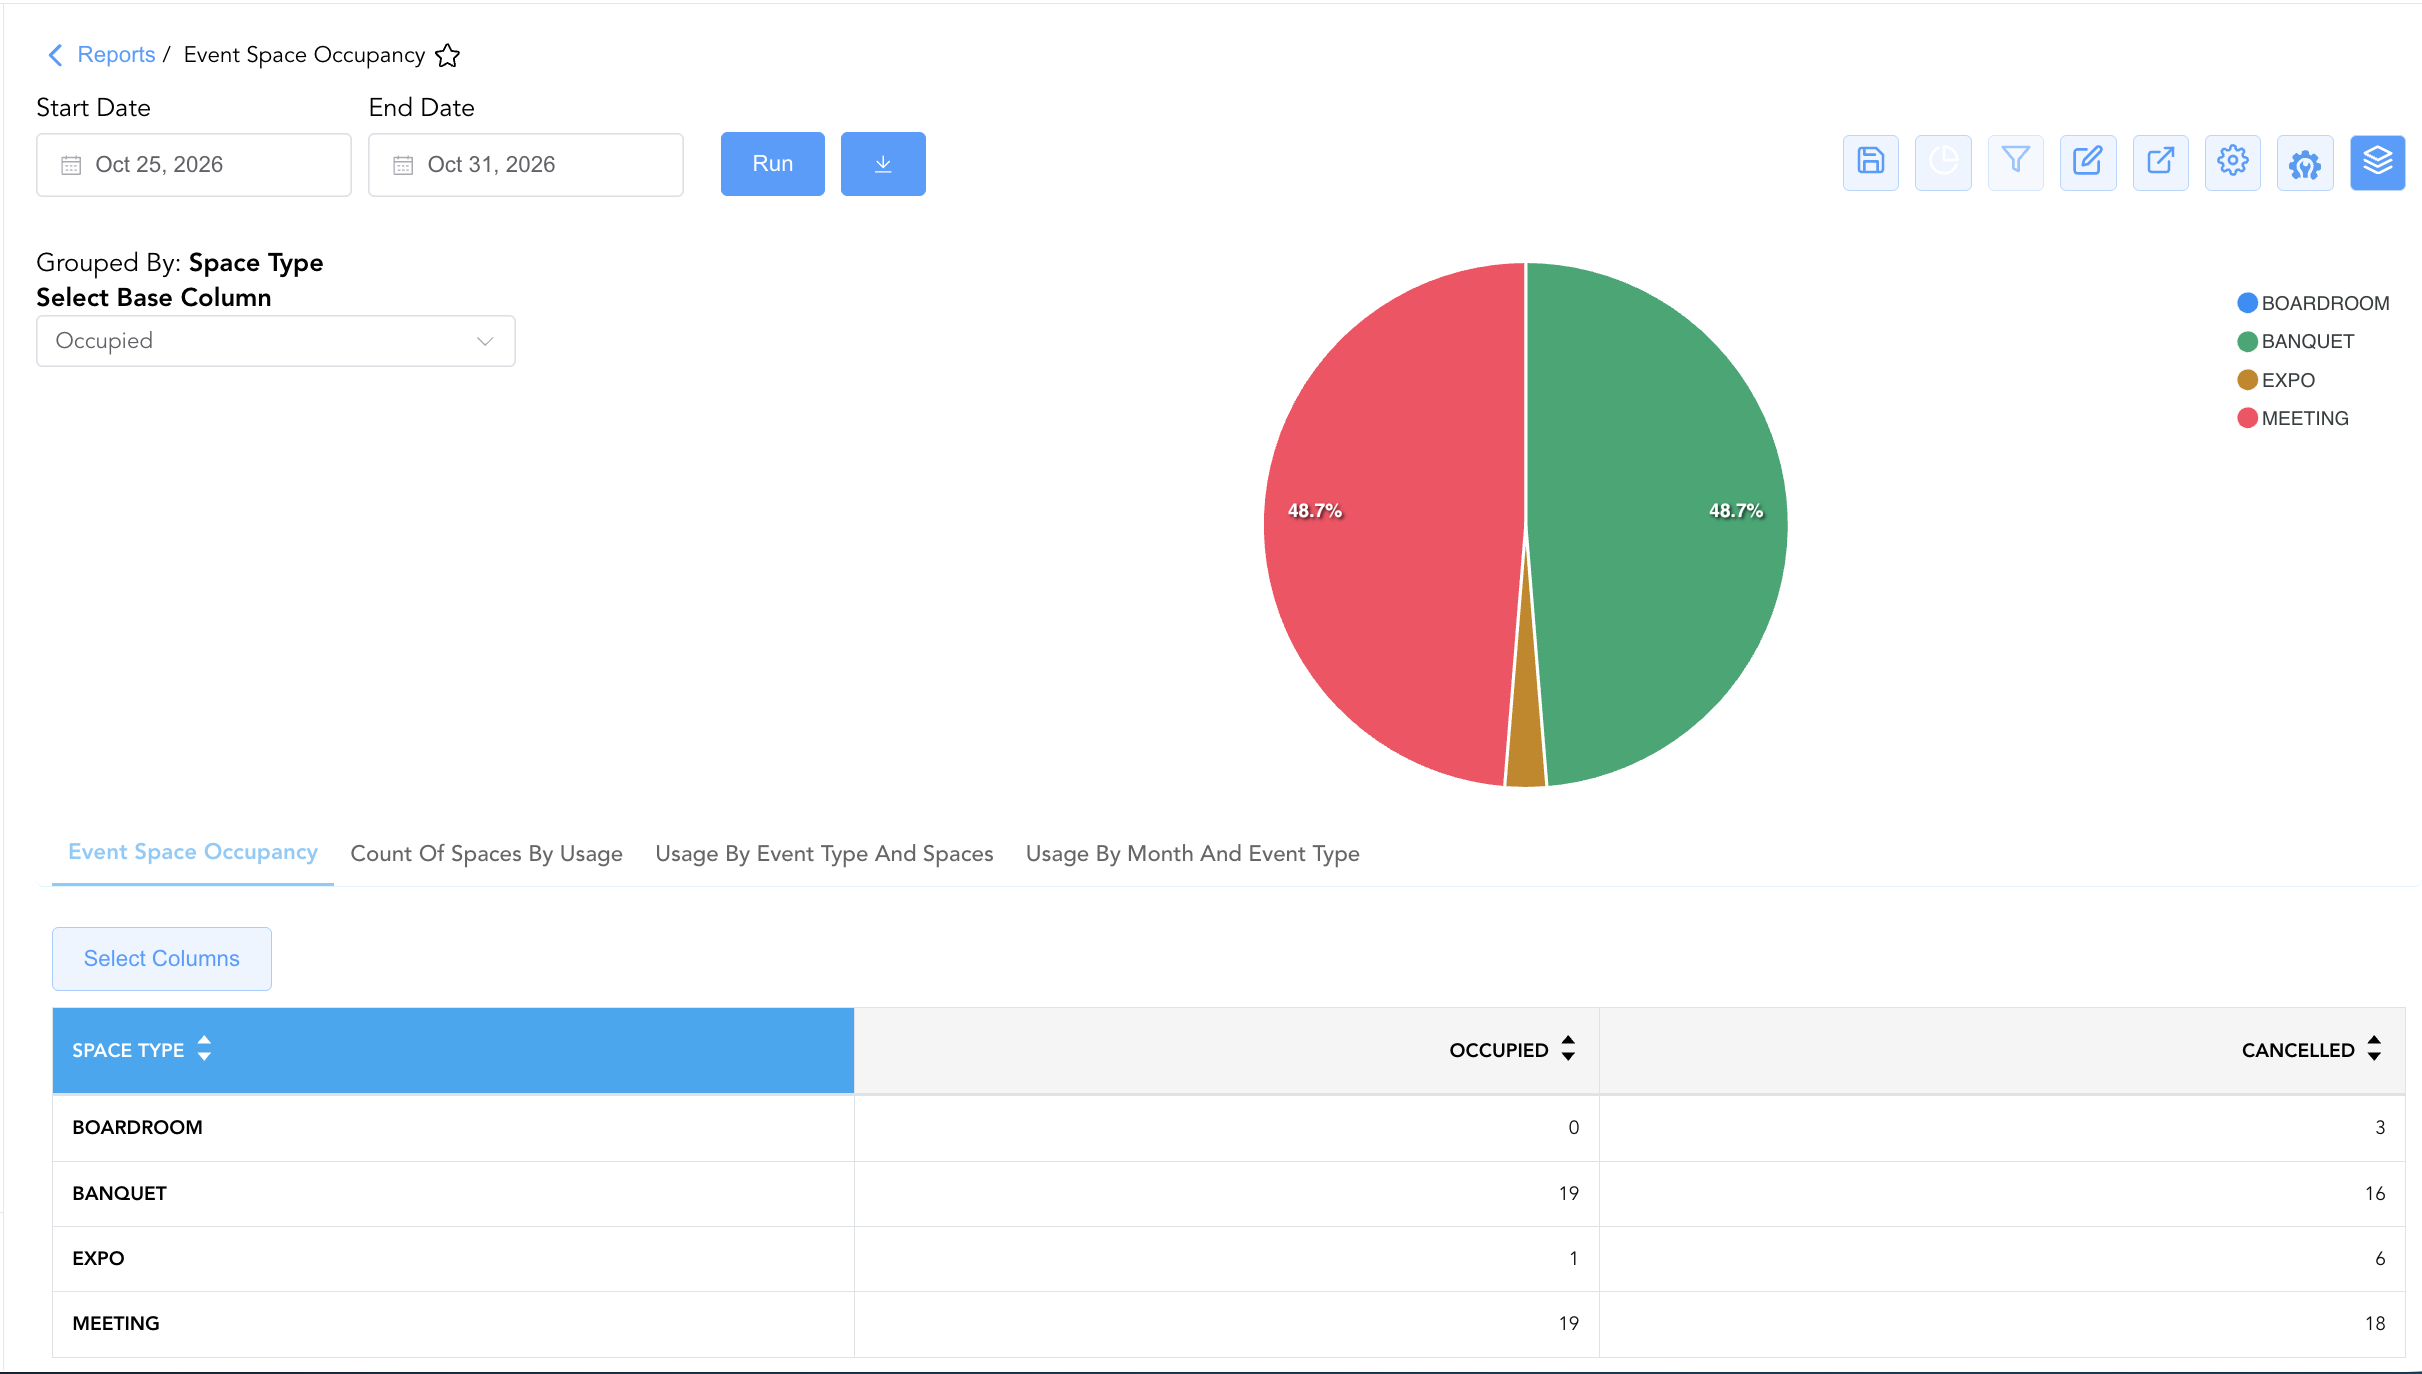
Group By & Pie Chart Visualization: The Event Space Occupancy report features an interactive pie chart to help analyze function space demand, venue utilization rates, and space cancellation distributions. Users can toggle or expand/collapse on the Event Space Occupancy section to group data by Month, Space Type, or Space Name across report tabs to analyze individual space occupancy, macro property usage totals, room-fit demand, or seasonal event-type distributions independently. By selecting a metric from the Select Base Column dropdown menu—such as Occupied or Cancelled—the chart dynamically renders percentage share breakdowns accompanied by an interactive color-coded legend.
Advanced Controls
-
Space Yield & Underutilization Audits: Filter Section 1 (
Event Space Occupancy) byOccupied = 0andVacant > 0to identify underperforming meeting rooms and re-evaluate minimum spend requirements or rental rates. -
Event Alignment & Room Pairing: Review Section 3 (
Usage By Event Type And Spaces) to ensure high-demand corporate functions (Convention/Congress) are directed toward optimal facility footprints. -
Highlighting (Conditional Formatting): Apply custom rules to automatically highlight high-occupancy venues (
Occupied > 15), rooms heavily impacted by cancellations (Cancelled > 5), or top-performing event categories.
🔗 Related Reports & Next Steps
Within 🤝 Sales, Groups & Events Reports & 🥂 Event Management (EventKey):
-
All Events Report – Two-section master event summary and sub-event execution log.
-
Event Books Report – Three-section catering sales audit tracking status-based yields, sub-event revenues, and attached room blocks.
-
Event Covers Report – Three-section catering attendance and cover revenue audit report.
-
Event Pace Report – Two-section commercial pace and pickup tracking report.
-
Event Space Availability Report – Real-time meeting room inventory and overbooking rule verification report.
Cross-Pillar Deep Dives:
-
🧹 Rooms & Facilities: Cross-reference vacant function rooms (
Vacantin Section 1) with Maintenance Activity Report and Maintenance Checklist Details Report to schedule deep cleanings, carpet shampooing, and AV hardware maintenance during unbooked windows. -
👥 Group Block: Align space occupancy (
Occupied,Space Name) with Group Activity Report and Group Reservation Details Report to ensure banquet ballroom holds match guest room block arrival and departure flows.