
Enterprise Occupancy and Revenue by Source
Report Description: The Enterprise Occupancy and Revenue by Source report provides a predictive overview of revenue, stays, ADR (Average Daily Rate), occupancy contribution, and RevPAR (Revenue per Available Room) contribution by booking source for a future defined date, assisting property managers in revenue forecasting and strategic planning.
Date Range: This report can render the data for up to 365 days in the past or future
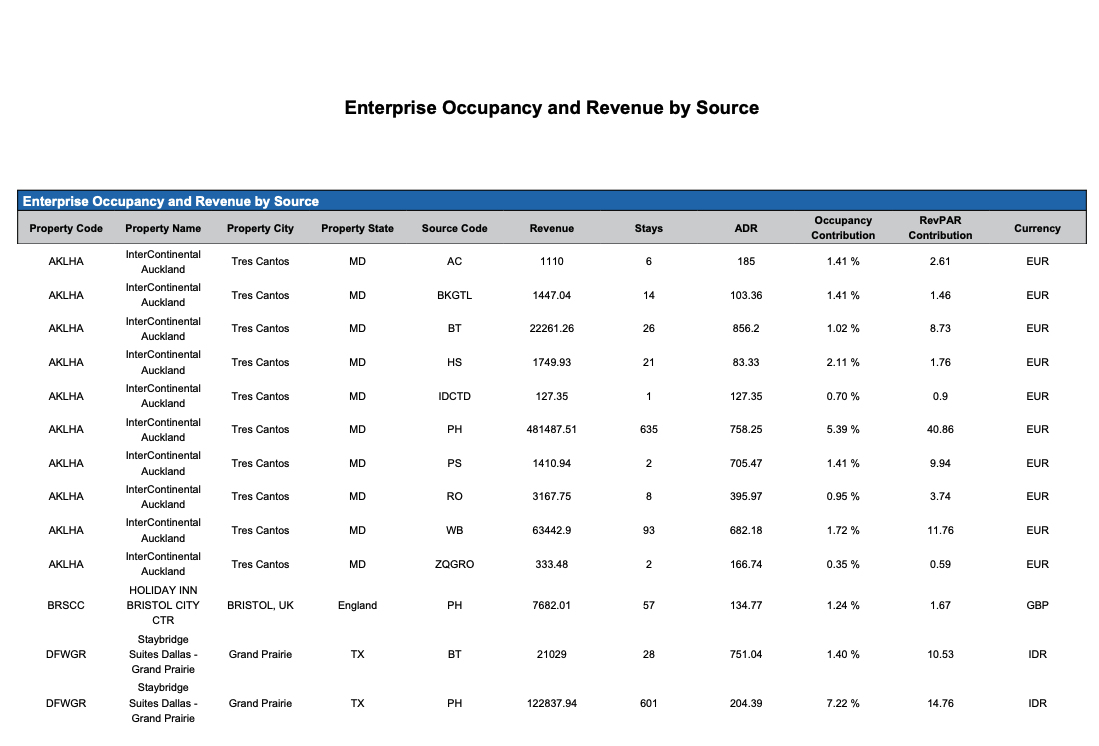
Enterprise Occupancy and Revenue by Source Section: provides an overview of revenue and occupancy for the defined dates for all properties in the region.
Available Report Columns for Following Sections:
|
Column Name |
Column Description |
Amount Includes Taxes and Fees |
Calculation |
|
Property Code |
Identifies the hotel code |
Not Applicable |
Not Applicable |
|
Property Name |
Identifies the name of the hotel |
Not Applicable |
Not Applicable |
|
Property City |
Identifies the City the hotel is operating |
Not Applicable |
Not Applicable |
|
Property State |
Identifies the State the hotel is operating |
Not Applicable |
Not Applicable |
|
Source Code |
The booking source or channel through which reservations are made (e.g., phone, online, direct bookings). |
Not Applicable |
Not Applicable |
|
Revenue |
The forecasted revenue expected from bookings |
NO |
=sum(source revenue) |
|
Stays |
The forecasted number of stays or reservations |
Not Applicable |
=sum(forecasted number of stays) |
|
ADR |
The forecasted Average Daily Rate for bookings |
NO |
ADR = (revenue / rooms sold) |
|
Occupancy Contribution |
Shows how much the bookings from the specified source contribute to the overall occupancy forecast |
Not Applicable |
occupancy contribution = (stays) / (inventory - OOO) |
|
RevPAR Contribution |
Indicates the contribution of bookings from the specified source to the overall Revenue per Available Room forecast |
NO |
RevPAR contribution = (revenue / total hotel inventory) |
|
Currency |
Monetary value used at the property |
Not Applicable |
Not Applicable |
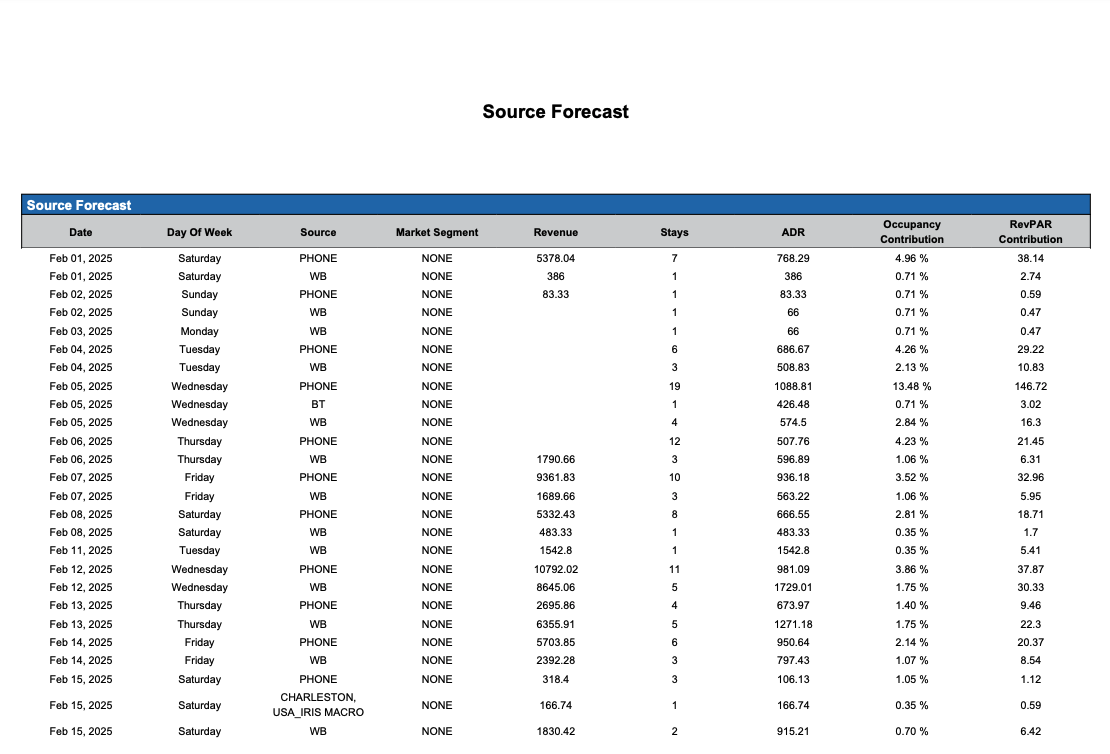
Source Forecast Section: provides a predictive overview of revenue, stays, ADR (Average Daily Rate), occupancy contribution, and RevPAR (Revenue per Available Room) contribution by booking source for a future defined date, assisting property managers in revenue forecasting and strategic planning.
|
Column Name |
Column Description |
Amount Includes Taxes and Fees |
Calculation |
|
Date |
The future date for which the forecast is provided |
Not Applicable |
Not Applicable |
|
Day of Week |
The day of the week corresponding to the future date |
Not Applicable |
Not Applicable |
|
Source |
The booking source or channel through which reservations are made (e.g., phone, online, direct bookings). |
Not Applicable |
Not Applicable |
|
Market Segment |
The market segment to which the booking source belongs |
Not Applicable |
Not Applicable |
|
Revenue |
The forecasted revenue expected from bookings |
NO |
=sum(source revenue) |
|
Stays |
The forecasted number of stays or reservations |
Not Applicable |
=sum(forecasted number of stays) |
|
ADR |
The forecasted Average Daily Rate for bookings |
NO |
ADR = (revenue / rooms sold) |
|
Occupancy Contribution |
Shows how much the bookings from the specified source contribute to the overall occupancy forecast |
Not Applicable |
occupancy contribution = (stays) / (inventory - OOO) |
|
RevPAR Contribution |
Indicates the contribution of bookings from the specified source to the overall Revenue per Available Room forecast |
NO |
RevPAR contribution = (revenue / total hotel inventory) |
Misc Report Information:
Available Features:
-
Export: ability to download and save the file into an alternate format.
-
Filter: filter a range of data based on criteria defined by the user.
-
Highlight: also known as conditional formatting is the ability to highlight certain values making them easier to identify.
-
Bar Graph: ability to view Revenue and Stay data in a bar chart.
-
Group By: ability to group data All, Source, Market Segment or Day of Week
Available Configuration:
-
User Preferences: allows the user to customize their report view by repositioning or removing columns.
-
Property Preferences: allows the property to customize the report view for all users by repositioning or removing columns.