
Guest Service Agent Productivity Report Overview
Parent Hub: ⚙️ System & Administration Reports
Category: 👤 User Activity Reports
Target Roles: Front Office Managers, Operations Directors, Guest Services Supervisors, Night Auditors, General Managers
Key Value: Evaluate front desk staffing efficiency, analyze hourly check-in and check-out traffic curves, benchmark agent operational throughput, monitor daily and monthly productivity trends, and optimize front desk shift scheduling.
Executive Summary
The Guest Service Agent Productivity Report is an essential front desk workforce management, guest processing velocity, and operational traffic analysis document within the 👤 User Activity Reports category of the ⚙️ System & Administration Reports hub. Designed to provide front office leadership with actionable intelligence on arrival and departure workflows, it itemizes hourly transaction volumes for check-ins and check-outs across specific dates, current month-to-date totals, and prior-month comparative benchmarks.
-
By organizing operational transaction data into 2 defined report sections: Total Check Ins and Total Check Outs, this report enables management to evaluate guest arrival surges (
Total Check Ins) separately from departure processing curves (Total Check Outs). It correlates operator credentials (User) and 24-hour time intervals (Time) with day-over-day operational volumes (September 22, 2026,September 21, 2026) and macro-level period totals (September, 2026,August, 2026) to identify peak desk congestion, align staffing rotas with physical guest arrivals, and minimize lobby wait times.
Key Capabilities
-
Two-Section Traffic Disaggregation: Separates guest arrival registrations (
Total Check Ins) from guest departure settlements (Total Check Outs) into dedicated operational views. -
24-Hour Hourly Distribution Analysis: Breaks down operational activity across exact one-hour time intervals (
Time, from00:00:00to23:00:00) to pinpoint daily arrival and departure volume peaks. -
Agent-Specific & Consolidated Team Tracking: Filters productivity metrics by individual front desk agent (
User) or across the consolidated front office team (User = ALL). -
Multi-Period Comparative Benchmarking: Simultaneously compares today's activity against yesterday's operations alongside month-to-date and prior-month historical volume baselines.
-
Staffing Optimization & Shift Scheduling: Delivers data-driven volume curves to support optimal shift scheduling, break timing, and terminal allocation during high-volume turnover periods.
Report Views & Functional Breakdown
The Guest Service Agent Productivity Report presents operational traffic and agent processing volumes across 2 defined sections:
┌────────────────────────────────────────────────────────────────────────┐
│             GUEST SERVICE AGENT PRODUCTIVITY REPORT                    │
├────────────────────────────────────────────────────────────────────────┤
│                       2 Defined Report Sections                        │
├──────────────────────────────────┬─────────────────────────────────────┤
│ 1. Total Check Ins               │ 2. Total Check Outs                 │
│    (Arrival Traffic & Check-Ins) │    (Departure Traffic & Check-Outs) │
└──────────────────────────────────┴─────────────────────────────────────┘
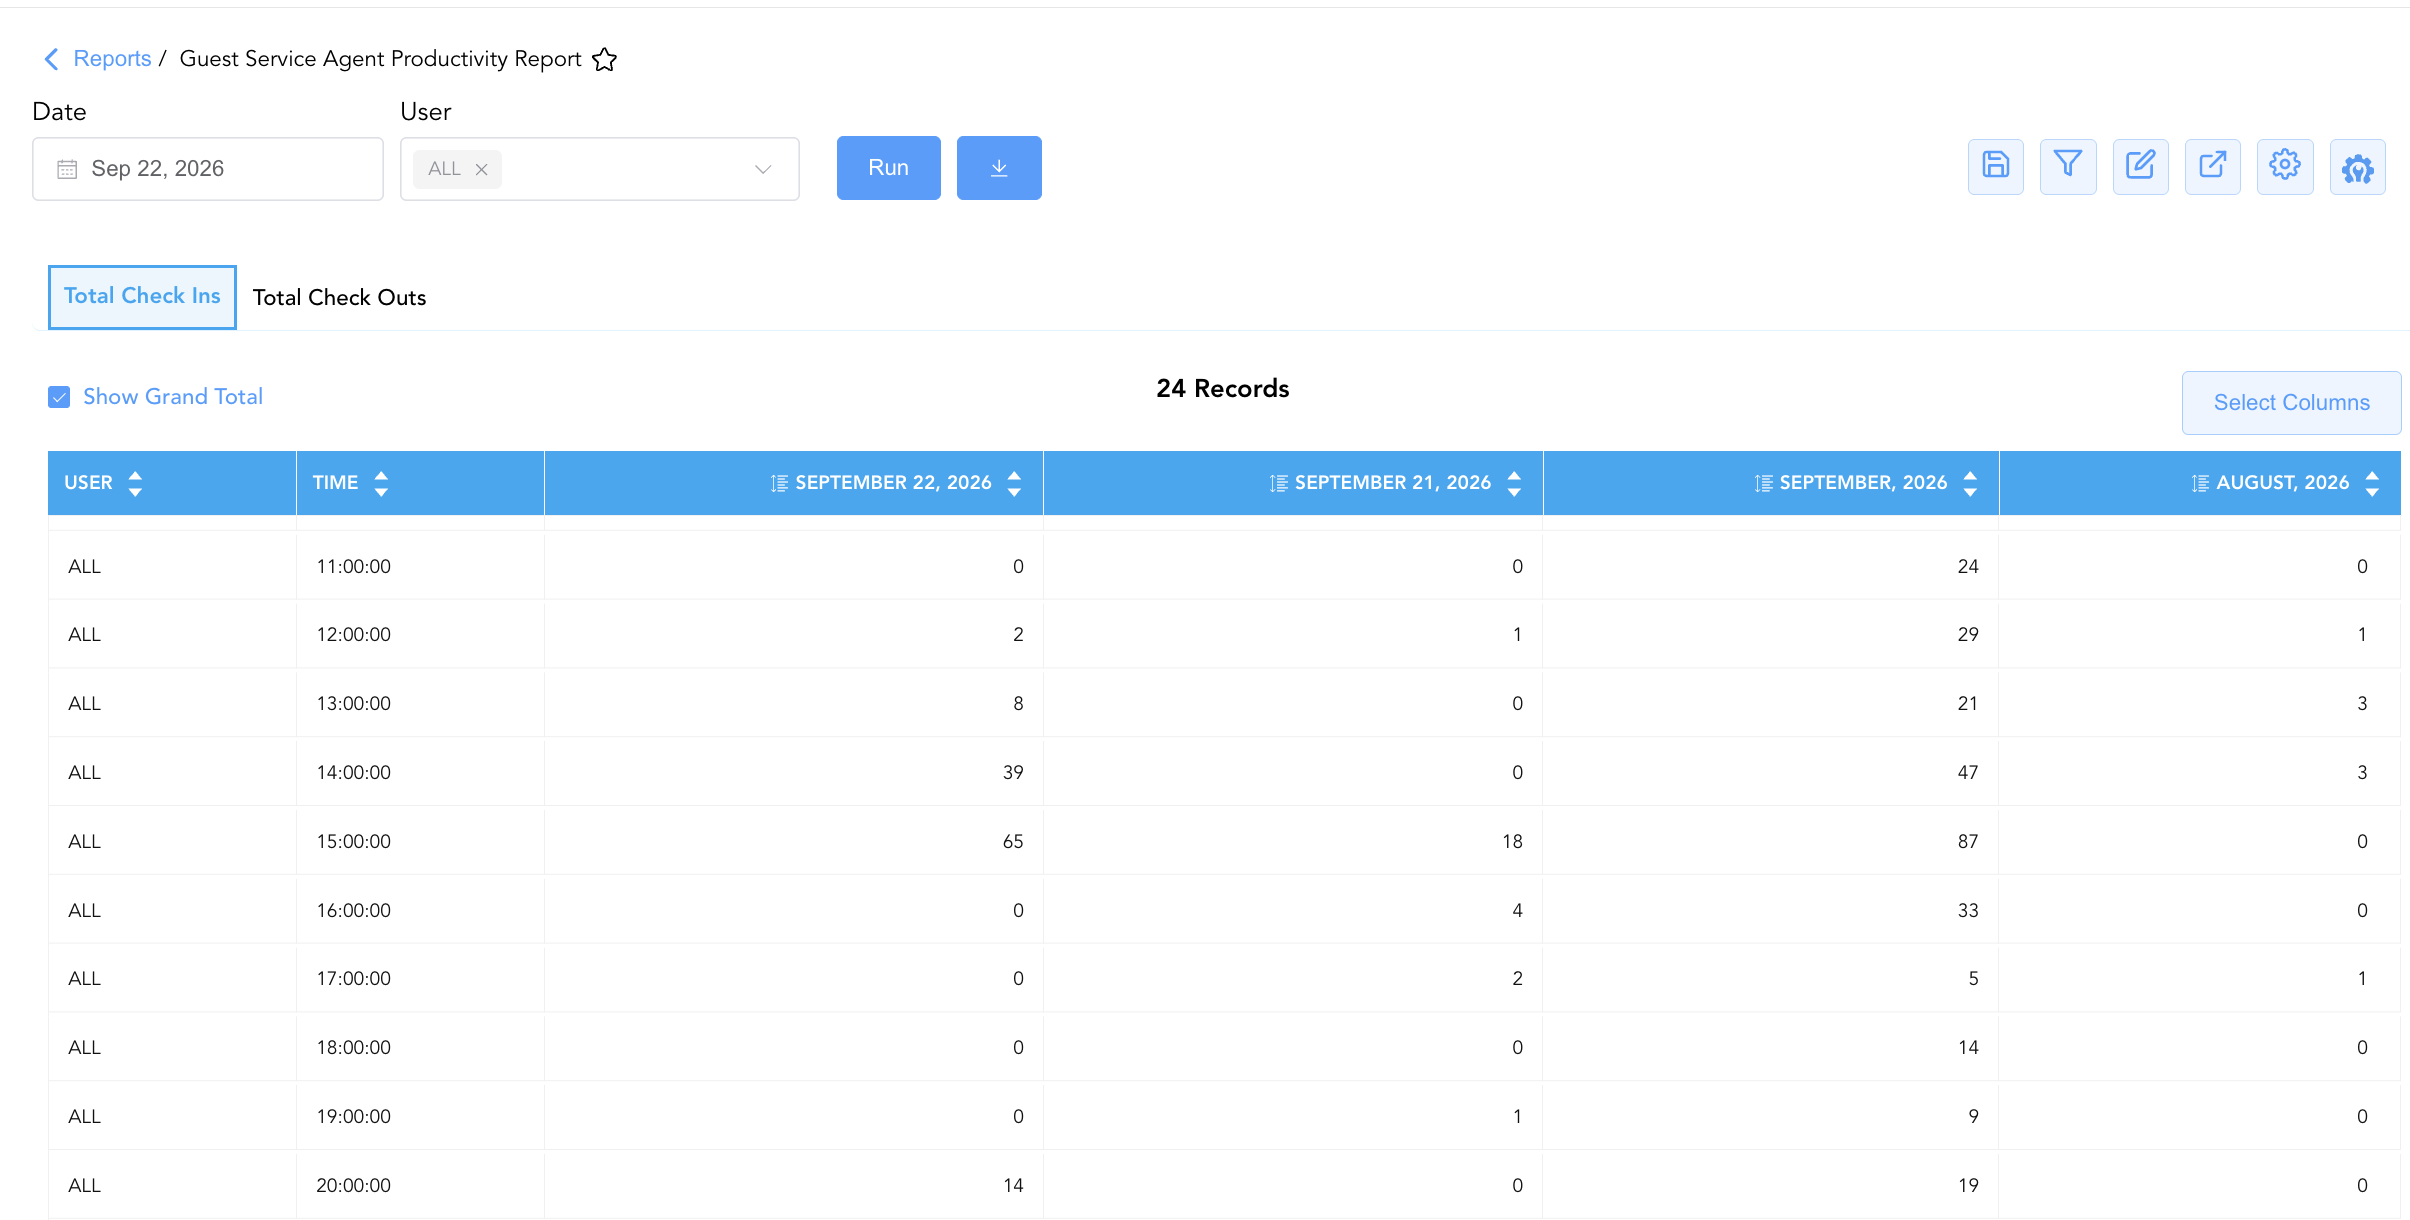
1. Total Check Ins Section (Arrival Traffic & Check-Ins)
Monitors guest registration volume across 24 hourly intervals, tracking check-ins completed today, yesterday, current month-to-date, and the prior month.
-
Primary Use: Analyzing guest arrival curves, scheduling afternoon front desk terminal staffing, auditing early check-ins, and managing evening arrivals.
-
Key Metrics: User, Time, September 22, 2026 (Selected Date), September 21, 2026 (Prior Day), September, 2026 (Month to Date), August, 2026 (Prior Month).
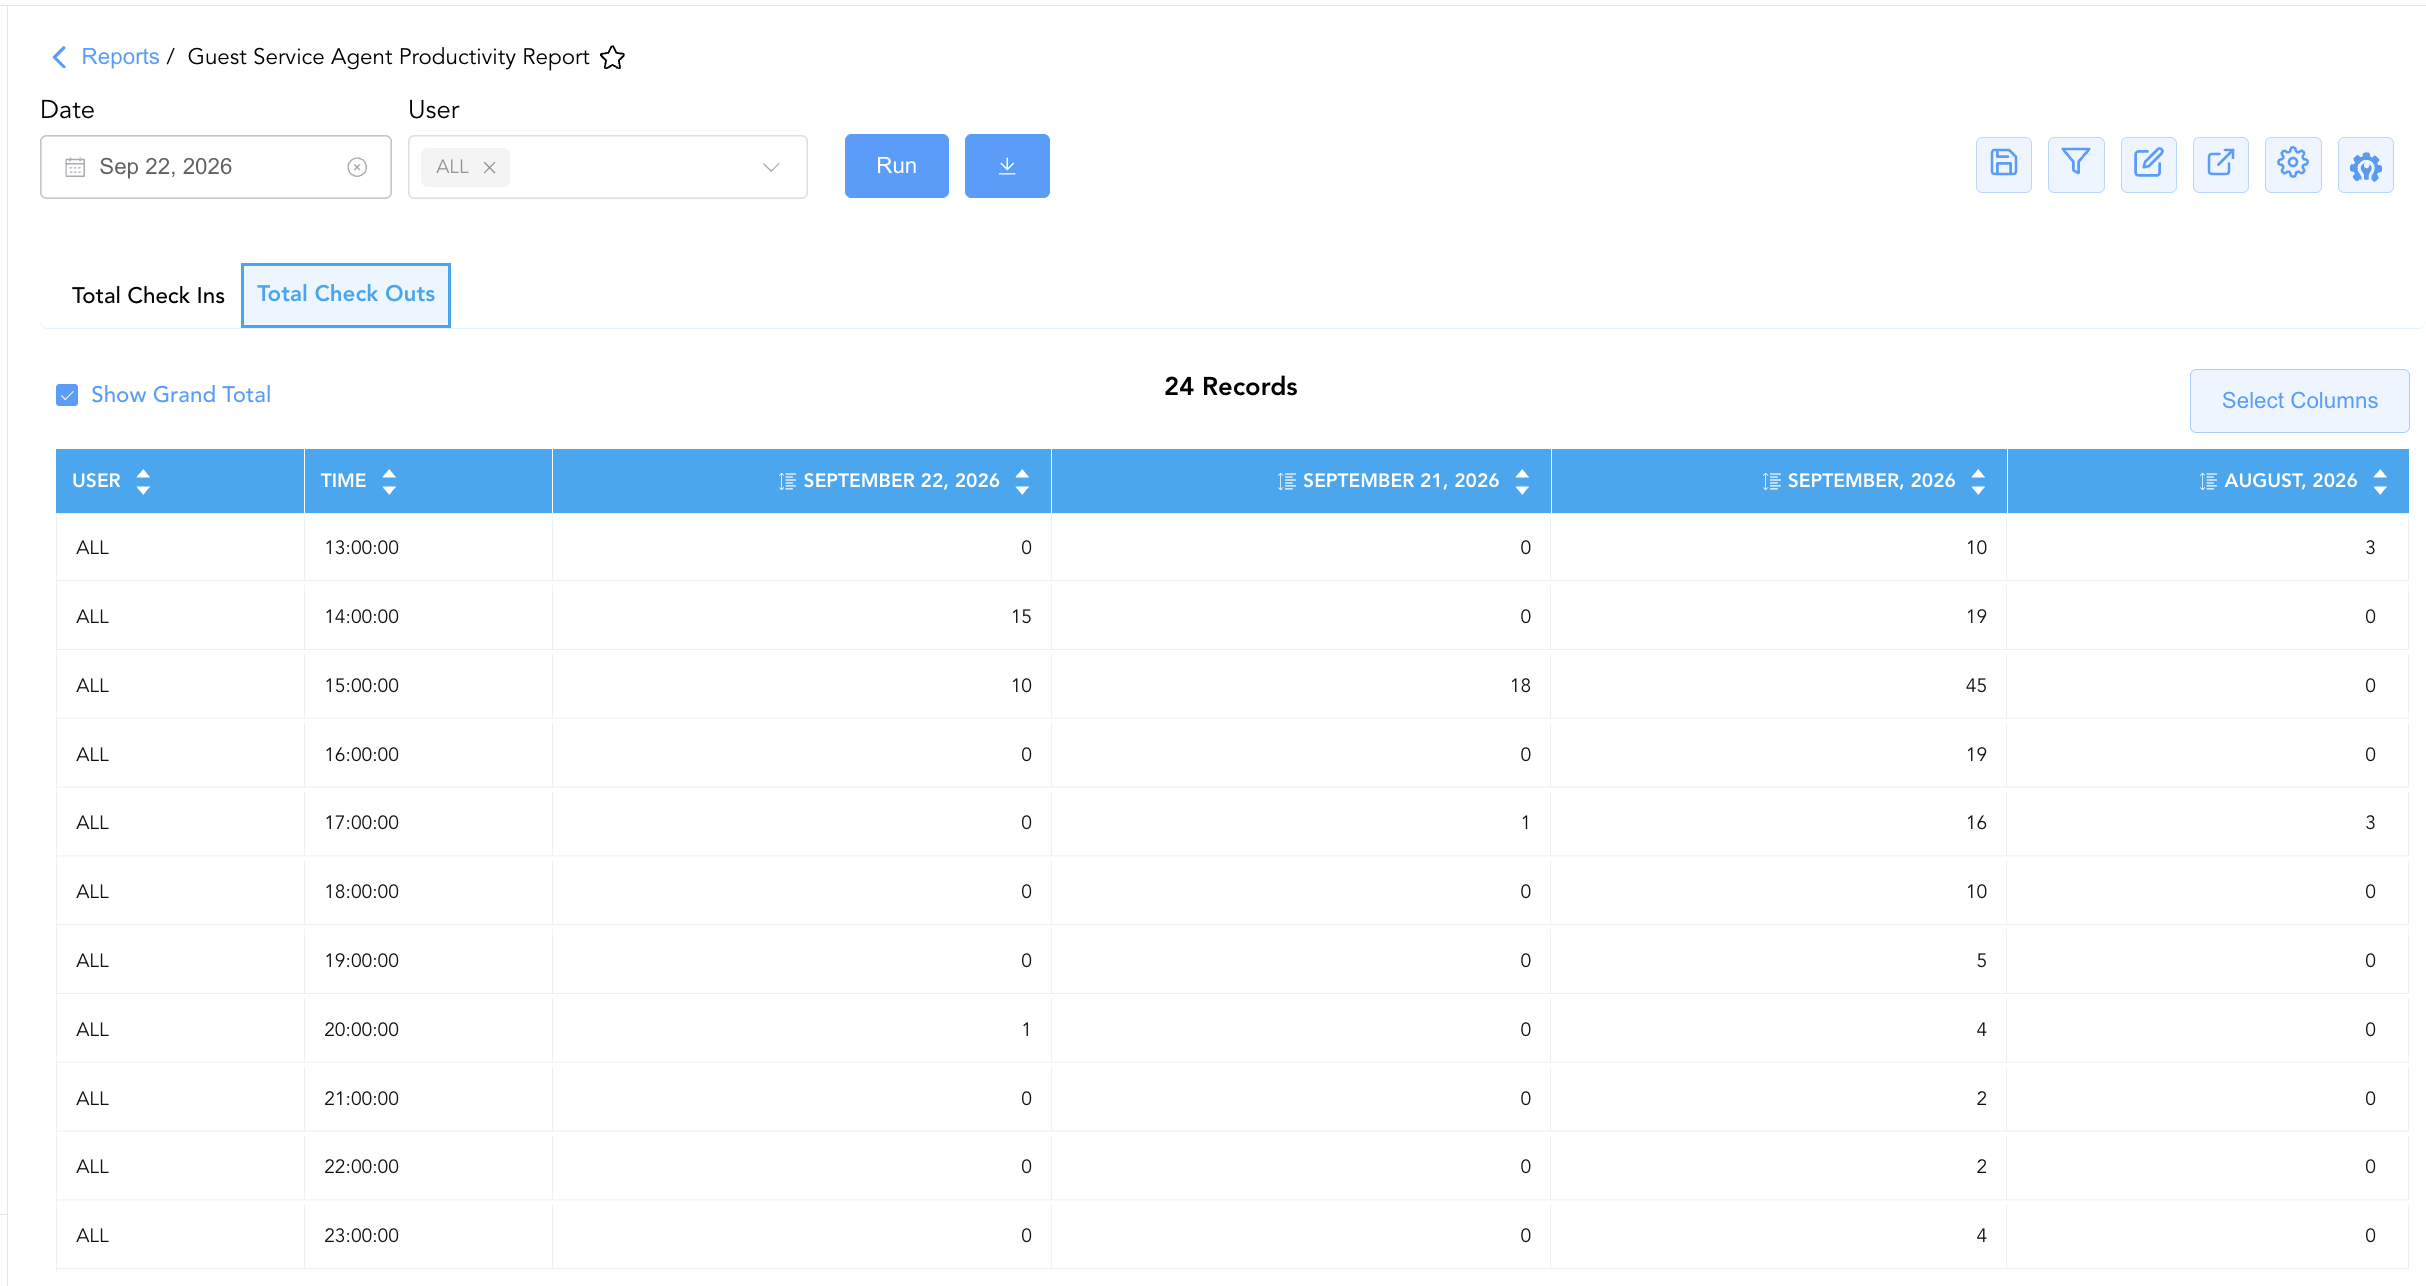
2. Total Check Outs Section (Departure Traffic & Check-Outs)
Monitors guest departure settlements and room release volume across 24 hourly intervals for the selected date, prior day, current month-to-date, and prior month.
-
Primary Use: Analyzing morning checkout congestion, scheduling morning front desk cashiers, tracking late check-outs, and feeding departure velocity data to housekeeping teams.
-
Key Metrics: User, Time, September 22, 2026 (Selected Date), September 21, 2026 (Prior Day), September, 2026 (Month to Date), August, 2026 (Prior Month).
Data Dictionary (Dynamic View Columns)
Customize your default view using the Configure (⚙️) icon on the report page. Below is the full data dictionary representing all 6 exact dynamic columns available across the 2 report sections, sorted in alphabetical order by column name:
ℹ️ Column Naming & Date Logic: The date and month column headers dynamically reflect the active reporting window selected at runtime. Figures represent physical transactional counts of completed check-in or check-out events.
|
Column Name |
Section Applicability |
Description |
Data Source / System Mapping |
Includes Taxes & Fees? |
|
August, 2026 |
Both Sections |
Cumulative count of check-ins or check-outs completed during the prior calendar month. |
Historical Audit Ledger > Prior Month Total |
N/A |
|
September 21, 2026 |
Both Sections |
Total count of check-ins or check-outs completed during the immediate prior operational day. |
Front Desk Audit Log > Prior Day Total |
N/A |
|
September 22, 2026 |
Both Sections |
Total count of check-ins or check-outs completed during the designated report target date. |
Front Desk Audit Log > Target Date Total |
N/A |
|
September, 2026 |
Both Sections |
Cumulative month-to-date count of check-ins or check-outs completed during the current operating month. |
Front Desk Audit Log > Current MTD Total |
N/A |
|
Time |
Both Sections |
Hourly operational time block representing the start of each one-hour interval (e.g., |
PMS Event Schedule > Hour Timestamp |
N/A |
|
User |
Both Sections |
Username, clerk identifier, or aggregated indicator representing the front desk agent ( |
User Security Master > Clerk Username |
N/A |
Customization & Platform Features
User & Property Preferences
-
Personal Preference: Tailor your individual view by hiding or dragging columns. Your preferences save automatically for future sessions.
-
Property Defaults: System Admins can configure standard default layouts across all property users to streamline operational reporting. To maximize audit efficiency, group the columns into the below logical blocks:
-
Section 1: Total Check Ins
-
Agent Accountability & Hourly Interval (Cols 1–2):
User|Time -
Daily Check-In Activity (Selected vs. Prior Day) (Cols 3–4):
month, date, year|month, date, year -
Monthly Check-In Production (Current vs. Prior Month) (Cols 5–6):
month, date, year|month, date, year
-
-
Section 2: Total Check Outs
-
Agent Accountability & Hourly Interval (Cols 1–2):
User|Time -
Daily Check-Out Activity (Selected vs. Prior Day) (Cols 3–4):
month, date, year|month, date, year -
Monthly Check-Out Production (Current vs. Prior Month) (Cols 5–6):
month, year|month, year
-
-
Report Toolbar & Quick Actions
Use the top-right toolbar icons on the report page to manage and export your data view:
|
Icon |
Action / Feature |
Description |

|
Knowledge Article |
Opens the knowledge base article to learn how to interpret this report. |

|
Saved Views |
Saves your column filtering, sorting, and highlight preferences so you can easily reload your custom view later without reconfiguring the report. |

|
Filter |
Opens filter controls to isolate specific data within a column based on your selected criteria. |

|
Highlight |
Highlights column values in a designated color based on selected conditions. |

|
Export |
Exports and downloads the report in various formats (Excel, PDF, CSV) for offline analysis or printing. |

|
Configure |
Opens column selection controls to toggle visibility, reorder columns, or hide rows with all zeros. |

|
Additional Configuration |
Provides advanced report configuration and display formatting options to customize data presentation. |
Advanced Controls
-
Peak Hour Staffing Optimization: Identify peak check-in intervals (e.g., 2:00 PM to 4:00 PM) and checkout peaks (e.g., 9:00 AM to 11:00 AM) to schedule overlapping front desk shifts and ensure all check-in terminals are staffed.
-
Agent Throughput Benchmarking: Filter by specific clerk usernames to measure individual transaction processing speeds and balance check-in allocations across team members.
-
Highlighting (Conditional Formatting): Apply custom rules to automatically highlight peak arrival hours (e.g., hourly check-ins > 30), high checkout hours, or off-peak hours with zero activity.
🔗 Related Reports & Next Steps
Within ⚙️ System & Administration Reports & 👤 User Activity Reports:
-
Clerk Activity – Two-section cashiering audit tracking line-item payments and shift tender summaries by clerk.
-
Clerk Reservation Summary – Staff performance audit tracking booking volume, lodging revenue yield, and cancellations by clerk.
-
Clerk Shift – Seven-section cashiering audit tracking drawer balances, cash drops, paid-outs, and shift intervals.
-
User Activity – Comprehensive security log tracking user logins, system navigation, and configuration updates.
Cross-Pillar Deep Dives:
-
🛎️ Front Desk & Guest Services: Correlate hourly check-in volume curves with Today's Guests, Arrivals List, and Departures List to manage physical lobby traffic and luggage storage workflows.
-
🧹 Rooms & Facilities: Align morning checkout velocity (
Total Check Outs) with Housekeeping Sheet and Room Status History to accelerate vacant dirty room turnover for incoming afternoon arrivals.