
Event Coordinator Productivity Report
The Event Coordinator Productivity Report provides a comprehensive view of guest room and event production by Event Coordinator, enabling teams to evaluate performance against both last year’s results and current-year goals. The report includes key performance metrics such as sales coordinator name, new definite bookings, event revenue budget, net confirmed revenue, tentative and prospect event revenue, and budget variances (both value and percentage). It also tracks comparative performance through measures such as lost, revaluation (Reval), and confirmed events across multiple timeframes—current period, year-to-date (YTD), and prior year—to help identify trends, opportunities, and areas for improvement in event sales productivity.
Report Date Range: This report can render the data for up to 365 days in the past.
Event Coordinator Productivity Report
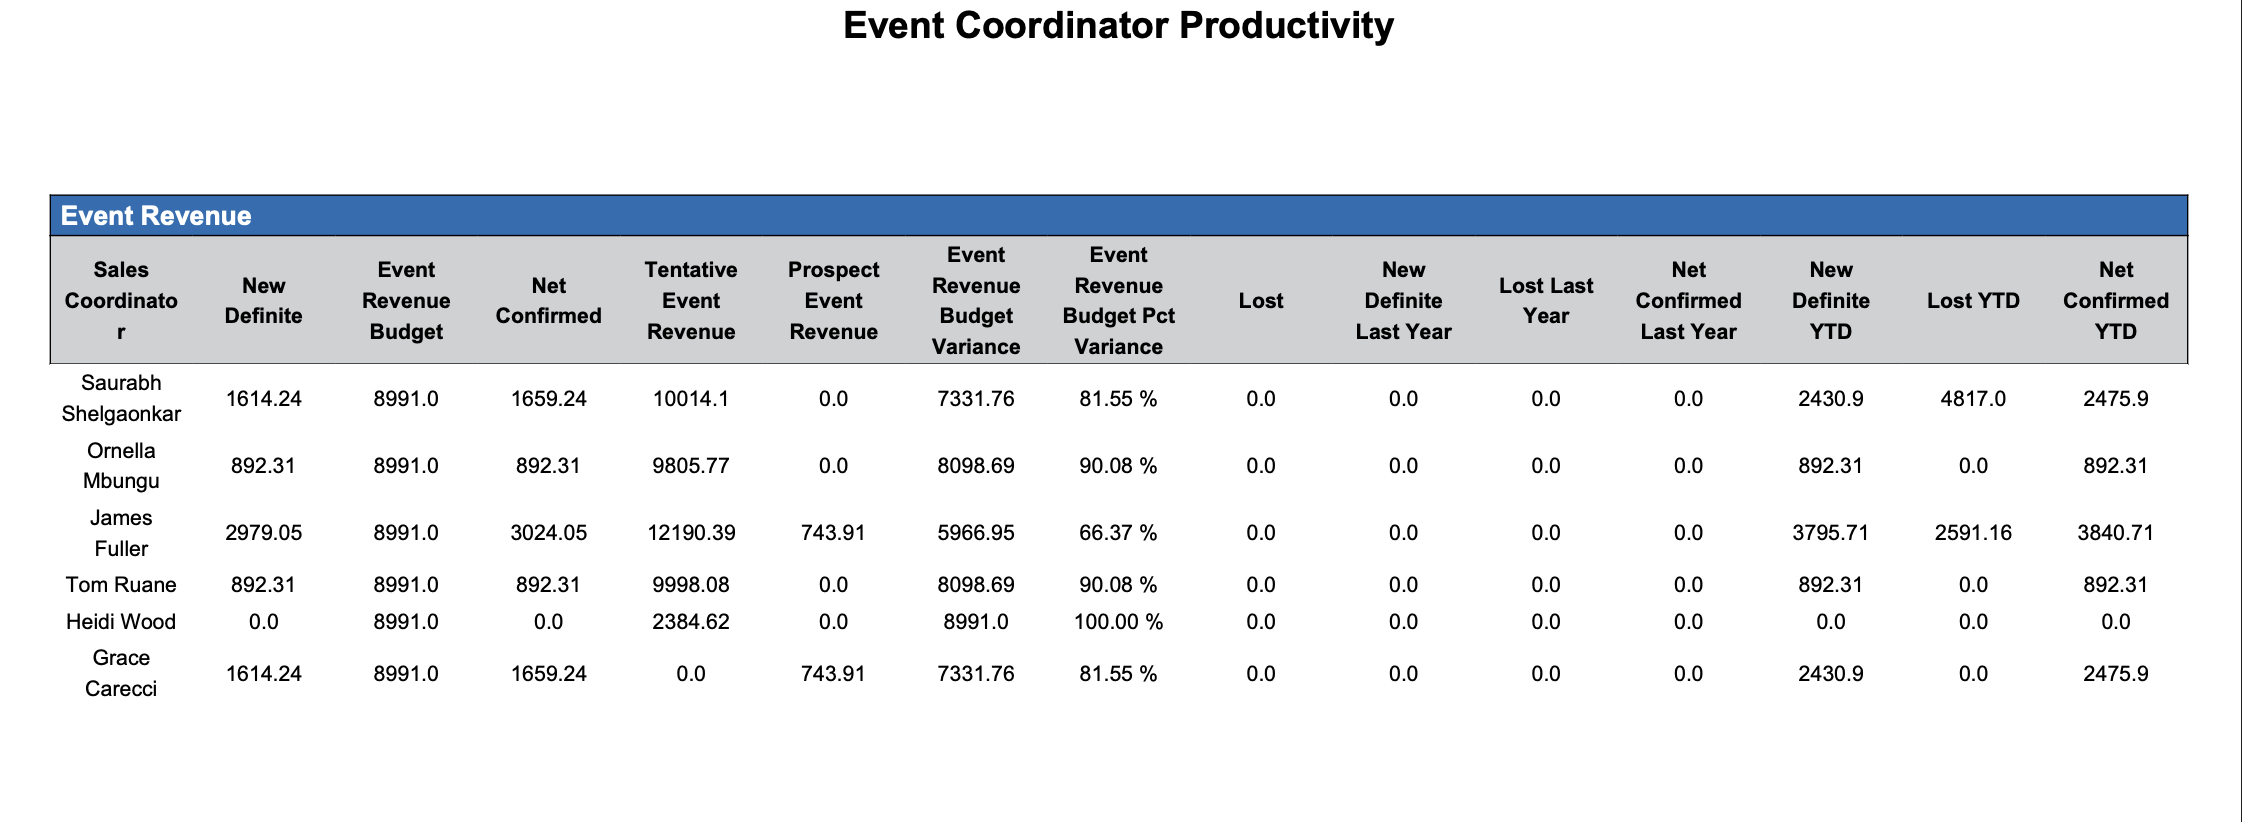
Event Coordinator Productivity Report – Dynamic View Overview
The Event Coordinator Productivity Report (Dynamic View) includes 18 columns of data. Users can customize the view by repositioning or hiding columns using the Configure (⚙️) icon located on the report page.
Below is a list of all available column names along with their descriptions.
|
Column Name |
Column Description |
Amount Includes Taxes and Fees |
Amount Calculation or Source of Data |
|
Event Revenue Budget |
The projected or planned revenue that a event coordinator expects to generate from events during a specific period — such as a month, quarter, or year. |
|
The value is sourced from the Daily Revenue Target filed enter on the Event Goal Setup Screen in EventKey Admin.
|
|
Event Revenue Budget Variance |
Event Revenue Budget Variance measures the difference between the actual (confirmed) event revenue and the budgeted event revenue for a given period. |
|
Event Revenue Budget Variance = Event Revenue Budget - Net Confirmed
|
|
Event Revenue Budget PCT Variance |
Event Revenue Budget % Variance represents the percentage difference between actual event revenue and the event revenue budget. It shows how much of the budgeted revenue remains to be picked up. |
|
Event Revenue Budget PCT Variance = Event Revenue Budget Variance / Event Revenue Budget
|
|
Lost |
Lost business refers to potential events or bookings that did not materialize — meaning a lead or opportunity that was pursued but ultimately did not convert into a confirmed event. Note: Lost business is defined as an inquiry or event with a cancelled status. |
|
Lost = Revenue from Cancelled Events or Inquiries
|
|
Lost Last Year |
The revenue from opportunities that were pursued but not secured during that month last year. Note: Lost business is defined as an inquiry or event with a cancelled status. |
|
Lost Last Year = ∑(Quoted Space Rate+Quoted Package Rate)
|
|
Lost YTD |
The total value of business opportunities that were lost from the start of the current fiscal year up to the reporting date. Note: Lost business is defined as an inquiry or event with a cancelled status.
|
|
Lost YTD = ∑(Quoted Space Rate+Quoted Package Rate)
|
|
Net Confirmed |
The total revenue from events that have been officially confirmed, minus any cancellations or lost business. It reflects the actual secured business and provides a more accurate measure of revenue that the property can expect to realize from confirmed bookings. |
|
Net Confirmed = (Revenue from Confirmed Events within Report Period)
|
|
Net Confirmed Last Year |
The total revenue from events that was officially confirmed during the same month last year. |
|
Net Confirmed Last Year = Revenue from Confirmed Events within Last Year’s Report Period
|
|
Net Confirmed YTD |
The total revenue from events that was officially confirmed from the start of the current fiscal year up to the reporting date. |
|
Net Confirmed YTD = Revenue from Confirmed Events from current fiscal year up to the reporting date
|
|
New Definite |
Total of the quoted rates for events (space + packages) that were confirmed within the selected date range. |
|
New Definite=∑(Quoted Space Rate+Quoted Package Rate)
|
|
New Definite Last Year |
Represents the total quoted revenue (space + packages) for events that were confirmed during the same date range last year. |
|
New Definite LY=∑(Quoted Space Rate+Quoted Package Rate)
|
|
New Definite YTD |
Represents the total quoted revenue (space + packages) for all events confirmed from the start of the year up to the selected date. |
|
New Definite YTD=∑(Quoted Space Rate+Quoted Package Rate)
|
|
Prospect Event Revenue |
The total revenue from events that are currently marked with a Prospect status, indicating potential business opportunities that have been identified but are not yet confirmed or contracted. |
|
Prospect Event Revenue = (Revenue from Prospect Events within Report Period)
|
|
Reval |
When an event or group booking has been marked as Confirmed (meaning the contract is signed and the business is considered booked) but changes happen (e.g., menu changes, guest count changes, space changes, service level changes), the revenue expectation for that booking changes. |
|
Reval = (Current Definite Revenue−Definite Revenue at Start of Period)
|
|
Reval Last Year |
The total revenue adjustments made after the event was confirmed during the same month last year. |
|
Reval Last Year = (Definite Revenue at End of PeriodLY−Definite Revenue at Start of PeriodLY)
|
|
Reval YTD |
The total change in revenue (positive or negative) for all bookings that were already Definite at the start of the year, and that experienced value changes while remaining Definite anytime from the start of the year up to the current date. |
|
RevalYTD=∑(Current Definite Revenue−Definite Revenue at Start of Year)
|
|
Sales Coordinator |
The associate at the property the goal was assigned to. |
|
The value is sourced from the Event Goal Setup Screen in EventKey Admin.
|
|
Tentative Event Revenue |
The total revenue from events that are currently marked with a Tentative status, indicating potential business opportunities that have been identified but are not yet confirmed or contracted. |
|
Tentative Event Revenue = (Revenue from Tentative Events within Report Period)
|
Miscellaneous Report Information
Available Features:
-
Export
Allows you to download and save the report in different file formats (e.g., Excel, PDF) for offline use or sharing. -
Filter
Enables you to narrow down the data by applying criteria you define, so you can focus on specific information. -
Highlight (Conditional Formatting)
Automatically highlights certain values based on rules you set, making key data easier to spot at a glance.
Available Configuration:
-
User Preferences
Customize your personal report view by rearranging, showing, or hiding columns according to your needs. -
Property Preferences
Configure the default report layout for all users at the property level by repositioning or disabling columns to streamline the view.
Baseline Configuration:
-
Property Preferences Settings
The following columns will be disabled for the initial deployment:
Not Applicable