
Event Pace Report Overview
Parent Hub: 🤝 Sales, Groups & Events Reports
Category: 🥂 Event Management (EventKey)
Target Roles: Directors of Sales, Catering & Event Directors, Revenue Managers, Hotel Controllers, General Managers
Key Value: Monitor catering and room block booking pace against monthly budgets, benchmark confirmed performance against Same Time Last Year (STLY), evaluate pipeline depth across prospect and tentative stages, and audit net booking changes including slippage, downgrades, and revaluations.
Date Parameter: Date Range Selector (Start & End) | Past & Future | Maximum Window: None
Executive Summary
The Event Pace Report is an essential commercial forecasting dashboard, catering pace audit, and revenue pickup analysis document within the 🥂 Event Management (EventKey) category of the 🤝 Sales, Groups & Events Reports hub. Designed to deliver strategic visibility over booking pickup velocity and budget attainment across both event catering functions and associated guest room blocks, it itemizes net booking changes, budget variance percentages, Same Time Last Year benchmarks, and unconfirmed pipeline stages over specified reporting windows.
-
By organizing pace data into 2 defined report sections: Event Pace Confirmed and Event Pace, this report enables commercial leaders and revenue directors to evaluate net pickup dynamics (
Event Pace Confirmed) alongside overall budget and historical pace benchmarking (Event Pace). It tracks core commercial metrics (Name, including Guest Rooms, Guest Rooms Revenue, Average Rate, Event Revenue, and Package Revenue) against net booking movements (New Definite,Lost Downgrade,Slippage,Reval,Net Change) and strategic performance targets (Confirmed,Budget,Variance,Pct Variance,Actual Last Year,Same Time Last Year,Variance Same Time Last Year,Total Prospect,Total Tentative).
Key Capabilities
-
Two-Section Pace & Pickup Structure: Separates net confirmed booking velocity adjustments (
Event Pace Confirmed) from macro budget and historical pace comparisons (Event Pace). -
Net Booking Velocity Audit: Disaggregates net additions (
New Definite) against contract cancellations (Lost Downgrade), block wash or attrition (Slippage), and scope adjustments (Reval) to calculate net net booking additions (Net Change). -
Budget Variance & Attainment Tracking: Compares confirmed revenue and room night commitments (
Confirmed) against approved property targets (Budget) to calculate absolute variances (Variance) and attainment percentages (Pct Variance). -
Historical Pace Benchmarking (STLY): Measures performance against final figures from the prior year (
Actual Last Year) and performance at the exact same point in time last year (Same Time Last Year) to compute true pace variance (Variance Same Time Last Year). -
Unconfirmed Pipeline Visibility: Tracks unmaterialized commercial demand across early-stage leads (
Total Prospect) and qualified holds (Total Tentative).
Report Views & Functional Breakdown
The Event Pace Report presents commercial pace and pickup data across 2 defined sections:
┌────────────────────────────────────────────────────────────────────────┐
│                        EVENT PACE REPORT                               │
├────────────────────────────────────────────────────────────────────────┤
│                       2 Defined Report Sections                        │
├──────────────────────────┬─────────────────────────────────────────────┤
│ 1. Event Pace Confirmed  │ 2. Event Pace                               │
│    (Net Pickup Velocity) │    (Budget & Historical Pace Benchmarks)    │
└──────────────────────────┴─────────────────────────────────────────────┘
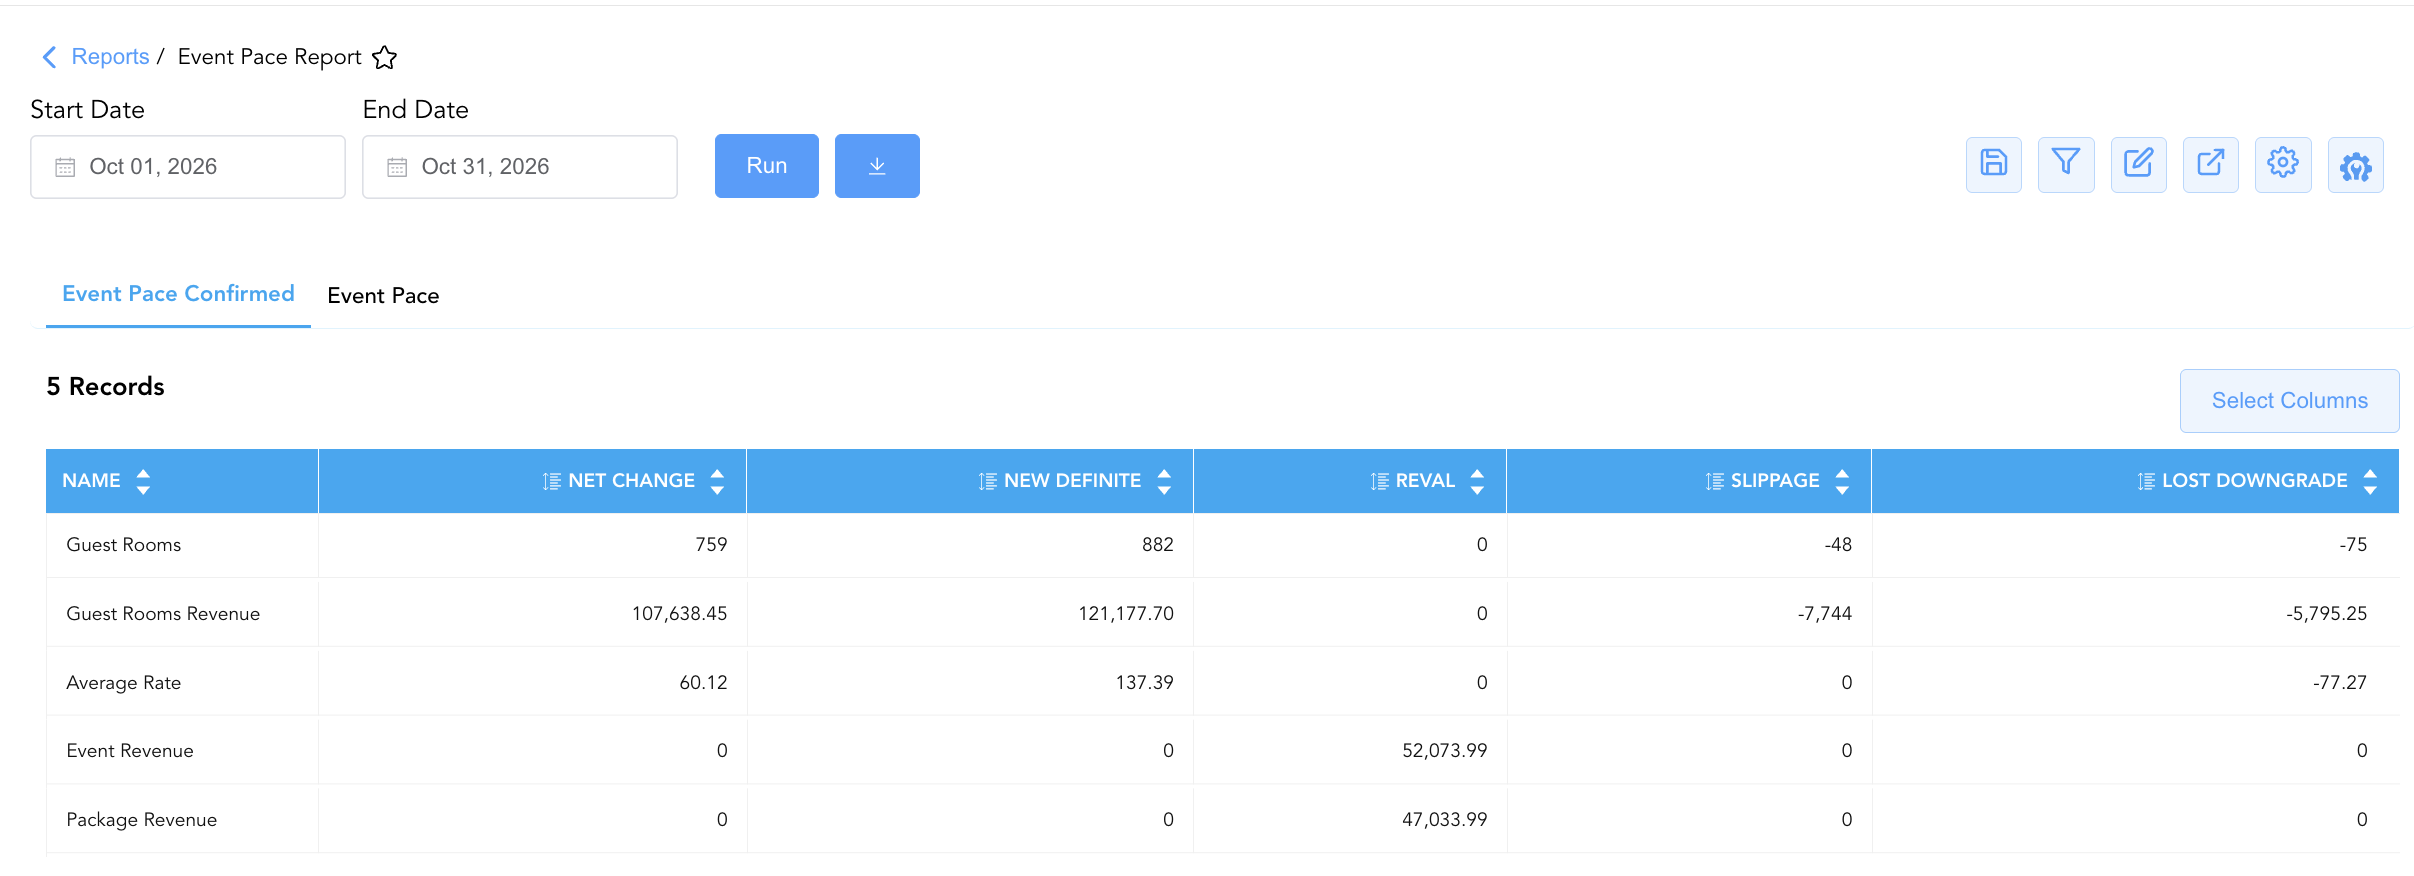
1. Event Pace Confirmed Section (Net Pickup Velocity)
Monitors the net change in confirmed bookings during the selected reporting timeframe across guest rooms, lodging revenue, average rates, catering event revenues, and package revenues.
-
Primary Use: Analyzing booking pickup during the reporting window, identifying contract slippage or wash, and auditing net gains in confirmed group and catering business.
-
Key Metrics: Name, New Definite, Lost Downgrade, Slippage, Reval, Net Change.
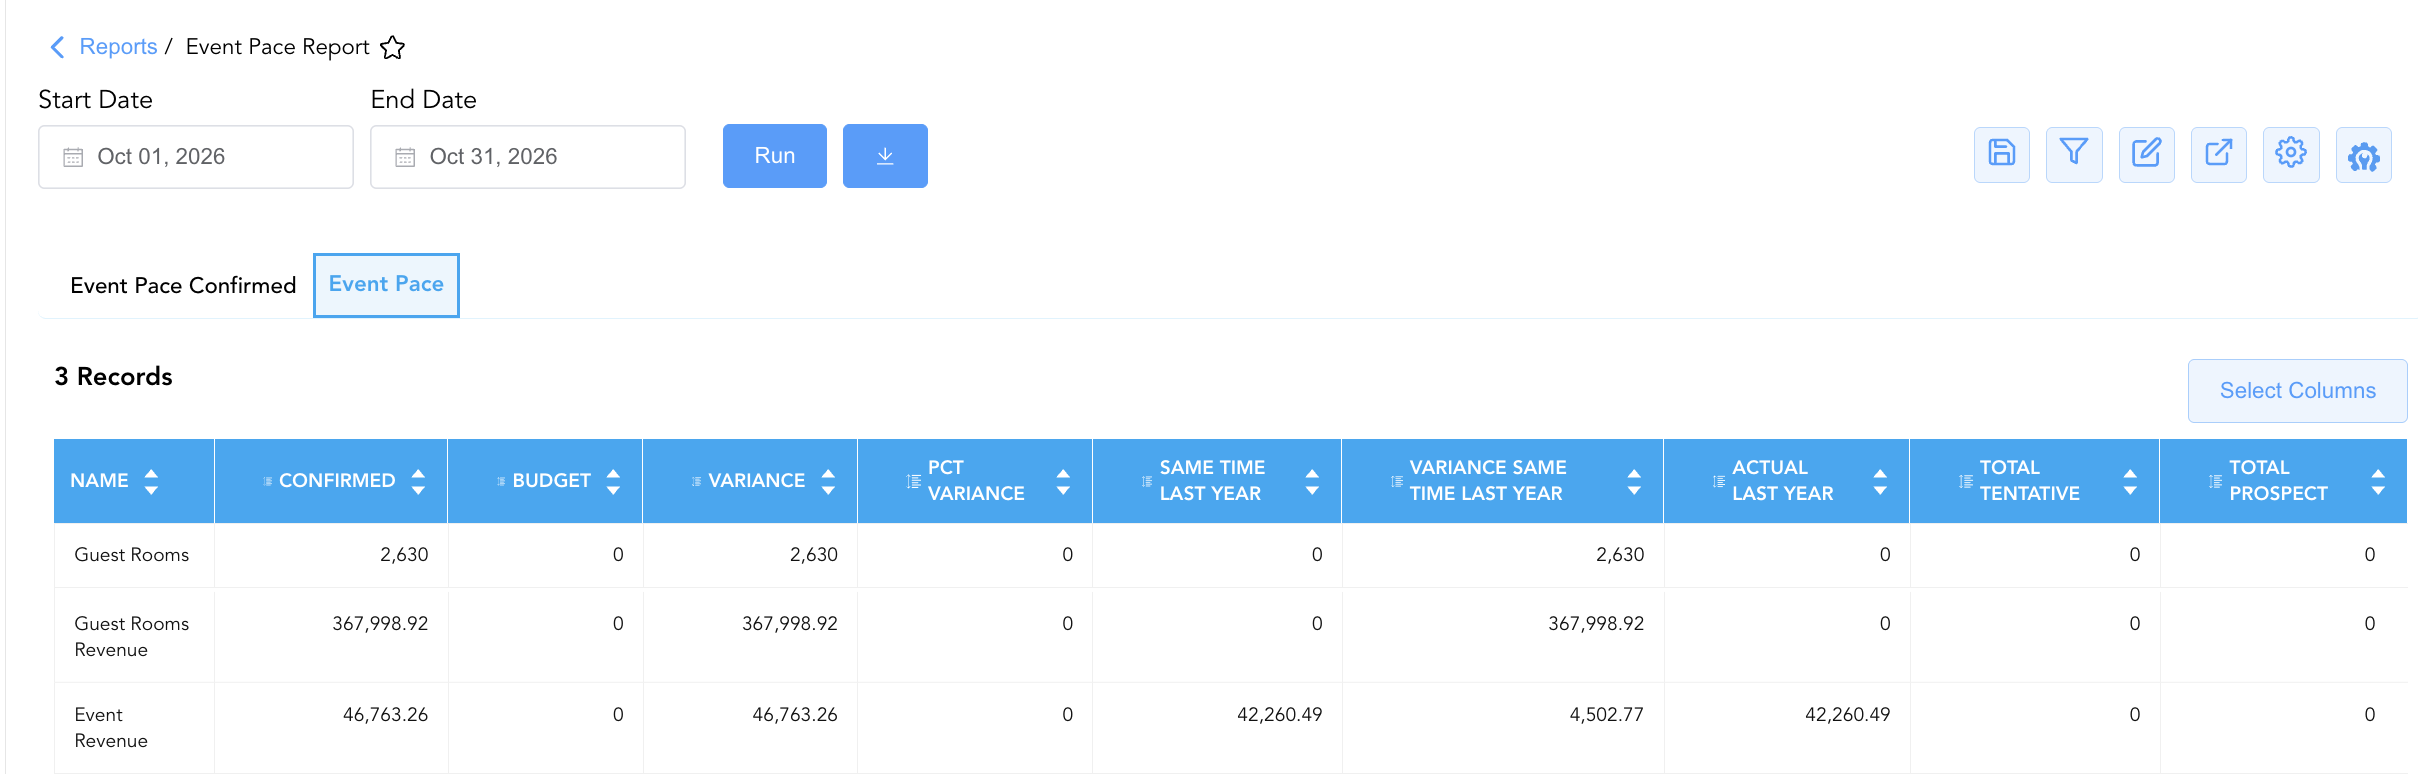
2. Event Pace Section (Budget & Historical Pace Benchmarks)
Compares cumulative confirmed performance against target budgets and historical benchmarks while tracking active pipeline reserves.
-
Primary Use: Evaluating quota attainment, projecting month-end performance, identifying pace deficits against prior year trends, and sizing unconfirmed pipeline depth.
-
Key Metrics: Name, Confirmed, Budget, Variance, Pct Variance, Actual Last Year, Same Time Last Year, Variance Same Time Last Year, Total Prospect, Total Tentative.
Data Dictionary (Dynamic View Columns)
Customize your default view using the Configure (⚙️) icon on the report page. Below is the full data dictionary representing all 15 exact dynamic columns available across the 2 report sections, sorted in alphabetical order by column name:
💰 Financial Posting Logic: Figures in
Guest Rooms Revenue,Average Rate,Event Revenue,Package Revenue,Budget, and pipeline categories reflect net charges posted or budgeted for event agreements.Net Changeis dynamically calculated as New Definite + Lost Downgrade + Slippage + Reval, andVariancereflects Confirmed - Budget.
|
Column Name |
Section Applicability |
Description |
Data Source / System Mapping |
Includes Taxes & Fees? |
|
Actual Last Year |
Section 2 |
Historical actual revenue or room nights realized for the same period in the prior year. |
Historical Ledger > Prior Year Actual |
❌ No |
|
Budget |
Section 2 |
Target budget quota established for the reporting period across rooms or event revenue. |
Sales Budget Setup > Target Budget |
❌ No |
|
Confirmed |
Section 2 |
Total confirmed revenue or room nights secured for the target period. |
Event Ledger > Confirmed Total |
❌ No |
|
Lost Downgrade |
Section 1 |
Revenue or room nights lost due to event/group block cancellations or contractual downgrades. |
Event Ledger > Cancelled / Downgraded |
❌ No |
|
Name |
Both Sections |
Performance metric category or revenue stream being measured (e.g., |
Pace Engine > Metric Category |
N/A |
|
Net Change |
Section 1 |
Net change realized across the metric during the period after accounting for additions, cancellations, slippage, and revaluations (New Definite + Lost Downgrade + Slippage + Reval). |
Calculated: Net Pickup Sum |
❌ No |
|
New Definite |
Section 1 |
Newly booked definite revenue or room nights added during the reporting timeframe. |
Event Ledger > New Definite Converted |
❌ No |
|
Pct Variance |
Section 2 |
Percentage realization variance between confirmed performance and budget quota. |
Calculated: Variance % |
N/A |
|
Reval |
Section 1 |
Monetary or room night revaluation adjustments applied to existing contracts. |
Event Ledger > Contract Revaluations |
❌ No |
|
Same Time Last Year |
Section 2 |
Benchmark performance recorded at the exact same point in time last year (STLY pace benchmark). |
Historical Ledger > STLY Benchmark |
❌ No |
|
Slippage |
Section 1 |
Attrition, wash, or unmaterialized rooms and revenue deducted from previously confirmed commitments. |
Group / Event Ledger > Block Wash |
❌ No |
|
Total Prospect |
Section 2 |
Total pipeline volume or revenue currently held in prospect status. |
Event CRM > Prospect Pipeline |
❌ No |
|
Total Tentative |
Section 2 |
Total pipeline volume or revenue currently held in tentative status. |
Event CRM > Tentative Pipeline |
❌ No |
|
Variance |
Section 2 |
Absolute monetary or volume variance between confirmed performance and target budget (Confirmed - Budget). |
Calculated: Budget Variance |
❌ No |
|
Variance Same Time Last Year |
Section 2 |
Pace variance difference comparing current confirmed performance against performance at the same time last year (Confirmed - Same Time Last Year). |
Calculated: STLY Pace Variance |
❌ No |
Customization & Platform Features
User & Property Preferences
-
Personal Preference: Tailor your individual view by hiding or dragging columns. Your preferences save automatically for future sessions.
-
Property Defaults: System Admins can configure standard default layouts across all property users to streamline operational reporting. To maximize audit efficiency, group the columns into the below logical blocks:
-
Section 1: Event Pace Confirmed
-
Metric Classification (Col 1):
Name -
Net Performance & Inflow KPIs (Cols 2–3):
Net Change|New Definite -
Contract Revaluations & Pipeline Adjustments (Col 4):
Reval -
Attrition, Downgrade & Cancellation Outflows (Cols 5–6):
Slippage|Lost Downgrade
-
-
Section 2: Event Pace
-
Metric Classification (Col 1):
Name -
Current Confirmed Production & Budget Performance (Cols 2–5):
Confirmed|Budget|Variance|Pct Variance -
Historical Prior-Year Pace Benchmarks (Cols 6–8):
Same Time Last Year|Variance Same Time Last Year|Actual Last Year -
Forward Pipeline Commitments (Cols 9–10):
Total Tentative|Total Prospect
-
-
Report Toolbar & Quick Actions
Use the top-right toolbar icons on the report page to manage and export your data view:
|
Icon |
Action / Feature |
Description |

|
Knowledge Article |
Opens the knowledge base article to learn how to interpret this report. |

|
Saved Views |
Saves your column filtering, sorting, and highlight preferences so you can easily reload your custom view later without reconfiguring the report. |

|
Filter |
Opens filter controls to isolate specific data within a column based on your selected criteria. |

|
Highlight |
Highlights column values in a designated color based on selected conditions. |

|
Export |
Exports and downloads the report in various formats (Excel, PDF, CSV) for offline analysis or printing. |

|
Configure |
Opens column selection controls to toggle visibility, reorder columns, or hide rows with all zeros. |

|
Additional Configuration |
Provides advanced report configuration and display formatting options to customize data presentation. |
Advanced Controls
-
Slippage & Attrition Analysis: Review Section 1
SlippageandLost Downgradeto assess contractual wash trends and refine group block cut-off policies. -
Pipeline Conversion Modeling: Compare
Total TentativeandTotal Prospectin Section 2 against budget deficits (Variance) to determine required closing conversion ratios. -
Highlighting (Conditional Formatting): Apply custom rules to automatically highlight negative budget variances (
Variance < 0), positive pace growth (Variance Same Time Last Year > 0), or high slippage figures.
🔗 Related Reports & Next Steps
Within 🤝 Sales, Groups & Events Reports & 🥂 Event Management (EventKey):
-
All Events Report – Two-section master event summary and sub-event execution log.
-
Event Books Report – Three-section catering sales audit tracking status-based yields, sub-event revenues, and attached room blocks.
-
Event Cancellation Reason Code Report – Two-section audit tracking root causes and staff logs for cancelled catering events.
-
Event Coordinator Productivity Report – Sales manager revenue performance and budget variance audit.
-
Event Covers Report – Three-section catering attendance and cover revenue audit report.
-
Event Inquiry Source Report – Inbound lead inquiry source channel performance and conversion audit report.
Cross-Pillar Deep Dives:
-
👥 Group Block: Cross-reference pace figures for guest rooms (
Guest Rooms,Guest Rooms Revenue,Average Rate) with Group Pickup Details Report, Group Activity Report, and Group Recap By Arrival Report to track daily room block pickup. -
📊 Financial & Revenue Management: Reconcile catering event revenue pace (
Event Revenue,Package Revenue) with monthly Trial Balance Report, food & beverage forecasts, and Coordinator Productivity Report.