
Rate Group Forecast Report Overview
Parent Hub: 📈 Revenue & Analytics
Category: 🔭 Yield & Forecasting
Target Roles: Directors of Revenue Management, Revenue Analysts, General Managers, Asset Managers, Central Reservations System (CRS) Administrators
Key Value: Evaluate forward-looking daily demand and revenue performance across rate groups, monitor rate group stay volume and Average Daily Rates (ADR), track rate group contribution to projected property occupancy and RevPAR, and optimize rate bucketing strategies for streamlined inventory control and pricing yield.
⚠️ SPECIAL SYSTEM NOTE: HOTELKEY RATE GROUP MANAGEMENT
This report and Knowledge Base Article are specifically designed for hotels managing Property Management System (PMS) rates through HotelKey. In HotelKey, Rate Groups allow the bucketing of multiple individual rate plans into centralized rate groups (e.g., CRS, Loyalty, Direct, Corporate). This enables revenue managers and property administrators to efficiently evaluate forward-looking demand, manage group-level inventory controls, streamline rate shopping, and project macro-level yield performance across grouped rate plans.
Executive Summary
The Rate Group Forecast Report is a primary forward-looking demand projection and rate strategy document within the 🔭 Yield & Forecasting category of the 📈 Revenue & Analytics hub. Designed to deliver high-level financial and occupancy foresight on grouped rate plans, it projects daily stay production, room revenue, Average Daily Rate (ADR), occupancy contribution, RevPAR contribution, and projected occupancy for every configured rate group.
-
By mapping rate group structures (Date, Day Of Week, Rate Group) to forward stay production and monetary metrics (Revenue, Stays, ADR, Occupancy Contribution, RevPAR Contribution, Projected Occupancy), this report enables revenue managers, general managers, and asset management teams to project the profitability of grouped rate categories, evaluate rate shopping bucketing strategy impact, monitor forward channel yield distribution, and align dynamic pricing controls.
Key Capabilities
-
HotelKey Rate Group Demand Forecasting: Projects daily stay volume (
Stays), gross base room revenue (Revenue), and Average Daily Rate (ADR) across all active rate group buckets for future arrival dates. -
Grouped Inventory & Dynamic Yield Optimization: Provides structured forward performance data across rate groups to support competitive rate shopping analysis and dynamic inventory fencing in HotelKey.
-
Forward Occupancy & RevPAR Impact Tracking: Measures the exact contribution of each rate group toward projected hotel occupancy share (
Occupancy Contribution) and overall projected RevPAR (RevPAR Contribution). -
Daily & Time-Series Horizon Benchmarking: Tracks day-by-day forecasted revenue fluctuations by rate group across target date ranges to identify projected compression dates, weekday versus weekend demand variances, and promotional group pickup trends.
Report Views & Functional Breakdown
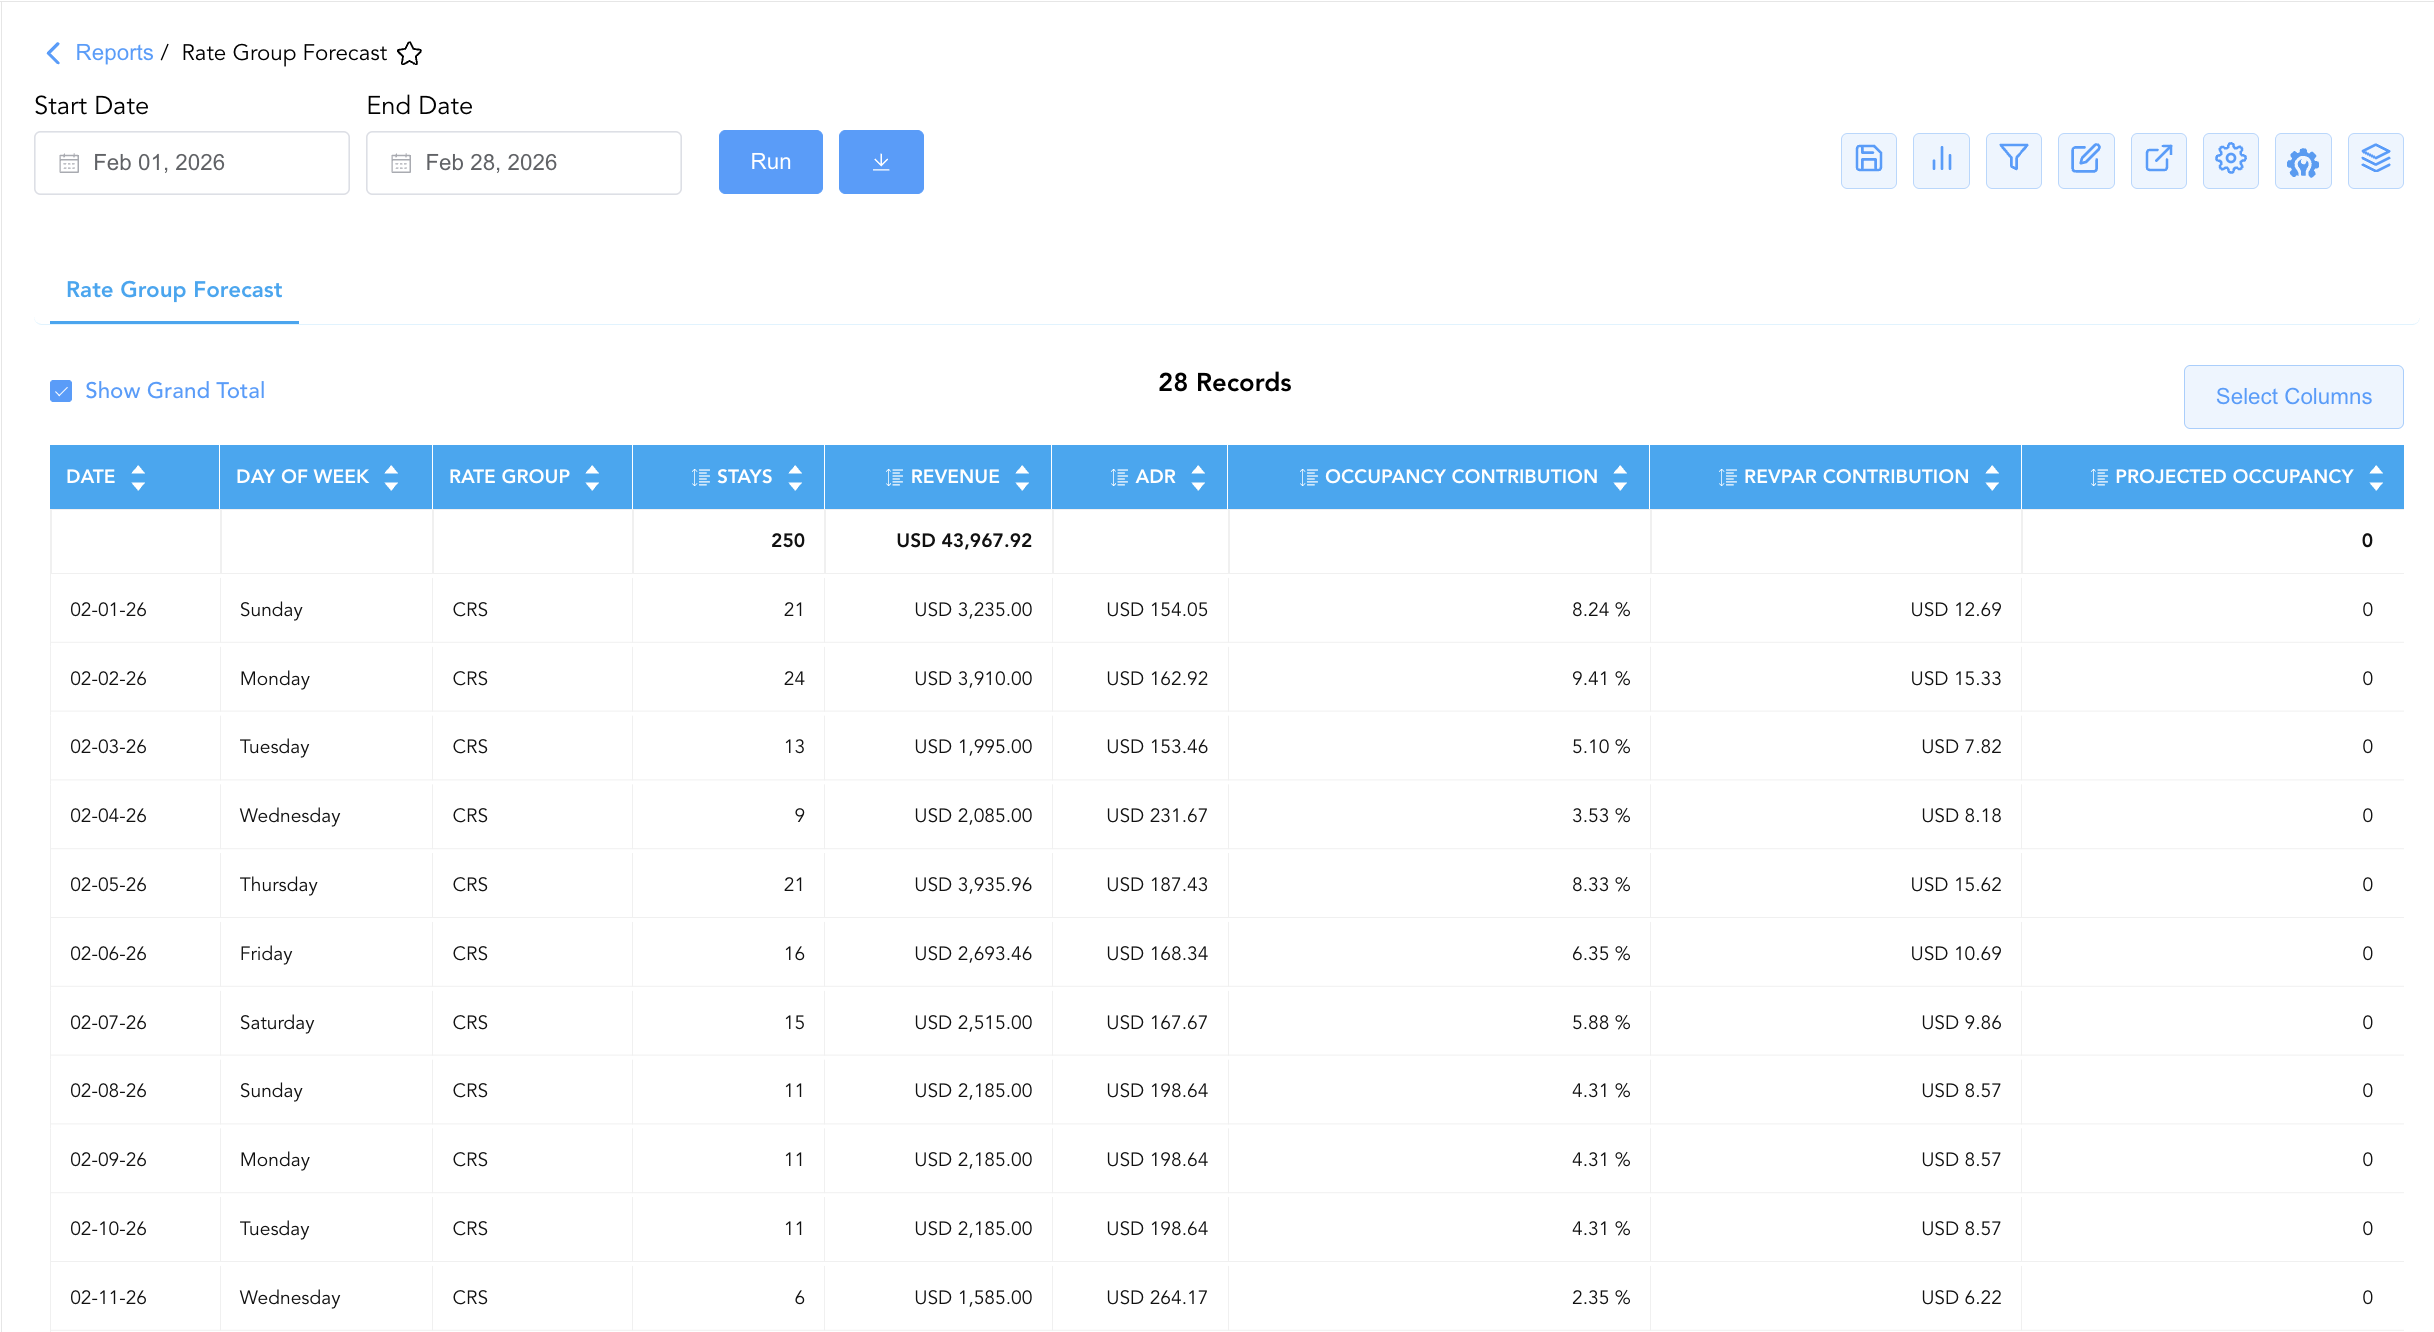
The Rate Group Forecast Report presents rate group forward demand metrics in a unified single-table ledger that supports three key analytical perspectives:
┌────────────────────────────────────────────────────────────────────────┐
│                   RATE GROUP FORECAST REPORT                           │
├────────────────────────────────────────────────────────────────────────┤
│                         Unified Matrix View                            │
├──────────────────────────┬──────────────────────────┬──────────────────┤
│ 1. Forward Revenue &     │ 2. Daily Stay Volume &   │ 3. Rate Group    │
│    Yield Projection      │    Rate Realization      │    Contribution  │
└──────────────────────────┴──────────────────────────┴──────────────────┘
1. Forward Revenue & Yield Projection
Monitors projected base room revenue generation and Average Daily Rates across individual rate group categories.
-
Primary Use: Evaluating which rate groups are projected to generate the highest total room revenue (
Revenue), auditing rate yield premiums (ADR), and identifying top-performing rate buckets for future stay dates. -
Key Metrics: Rate Group, Revenue, Stays, ADR.
2. Daily Stay Volume & Rate Realization
Tracks projected room night sales volume and realized rate performance by rate group over future daily timeframes.
-
Primary Use: Measuring forward stay production (
Stays), analyzing day-of-week rate group demand fluctuations, and tracking daily projected ADR realization across grouped rate plans. -
Key Metrics: Date, Day Of Week, Rate Group, Stays, ADR.
3. Rate Group Contribution Analysis
Identifies rate group-level contribution to projected property capacity, occupancy, and RevPAR.
-
Primary Use: Auditing rate group occupancy share (
Occupancy Contribution), measuring rate group impact on projected property RevPAR (RevPAR Contribution), and evaluating overall property occupancy build (Projected Occupancy). -
Key Metrics: Rate Group, Occupancy Contribution, RevPAR Contribution, Projected Occupancy, Revenue.
Data Dictionary (Dynamic View Columns)
Customize your default view using the Configure (⚙️) icon on the report page. Below is the full data dictionary representing every column available in this report:
💡 Monetary & Rate Calculation Note: Revenue and ADR represent Base Room Revenue (Excludes Taxes & Non-Room Charges). ADR is calculated as ADR = Revenue ÷ Stays.
|
Column Name |
Description |
Data Source / System Mapping |
Includes Taxes & Fees? |
|
Date |
Projected calendar date of the reported stay production (e.g., 2026-02-01). |
HotelKey PMS > Target Stay Date |
N/A |
|
Day Of Week |
Corresponding day of the week for the stay date (e.g., Sunday, Monday). |
System Calendar > Day Of Week |
N/A |
|
Rate Group |
Centralized rate group bucket combining multiple rate plans in HotelKey (e.g., CRS, Loyalty, Direct, Corporate). |
HotelKey Rate Management > Rate Group Name |
N/A |
|
Revenue |
Projected gross base room revenue generated by stays assigned to the rate group on the date. |
SUM(Projected Rate Group Room Revenue) |
❌ No |
|
Stays |
Total physical room nights / stays projected for the rate group on the date. |
SUM(Projected Stays by Rate Group) |
N/A |
|
ADR |
Average Daily Rate projected per room stay for the rate group (Revenue ÷ Stays). |
Revenue / Stays |
❌ No |
|
Occupancy Contribution |
Proportion of total available room capacity projected to be contributed by the rate group on the date. |
Stays / Total Available Rooms |
N/A |
|
RevPAR Contribution |
Revenue Per Available Room projected to be contributed by the rate group on the date. |
Revenue / Total Available Rooms |
❌ No |
|
Projected Occupancy |
Overall hotel occupancy percentage projected for the stay date incorporating all rate groups. |
Total Projected Rooms / Hotel Capacity |
N/A |
Customization & Platform Features
User & Property Preferences
-
Personal Preference: Tailor your individual view by hiding or dragging columns. Your preferences save automatically for future sessions.
-
Property Defaults: System Admins can configure standard default layouts across all property users to streamline operational reporting. To maximize audit efficiency, group the columns into the below logical blocks.
-
Time & Segmentation (Cols 1–3):
Date|Day Of Week|Rate Group -
Volume & Revenue Production (Cols 4–5):
Stays|Revenue -
Yield & Contribution Metrics (Cols 6–8):
ADR|Occupancy Contribution|RevPAR Contribution -
Forecast Occupancy (Col 9):
Projected Occupancy
-
Report Toolbar & Quick Actions
Use the top-right toolbar icons on the report page to manage and export your data view:
|
Icon |
Action / Feature |
Description |

|
Knowledge Article |
Opens the knowledge base article to learn how to interpret this report. |

|
Saved Views |
Saves your column filtering, sorting, and highlight preferences so you can easily reload your custom view later without reconfiguring the report. |

|
Bar Chart |
Displays report data in a visual bar chart format. |

|
Filter |
Opens filter controls to isolate specific data within a column based on your selected criteria. |

|
Highlight |
Highlights column values in a designated color based on selected conditions. |

|
Export |
Exports and downloads the report in various formats (Excel, PDF, CSV) for offline analysis or printing. |

|
Configure |
Opens column selection controls to toggle visibility, reorder columns, or hide rows with all zeros. |

|
Additional Configuration |
Provides advanced report configuration and display formatting options to customize data presentation. |

|
Group By |
Summarize and group report data dynamically in real time. |
Interactive Visualizations & Grouping Controls
-
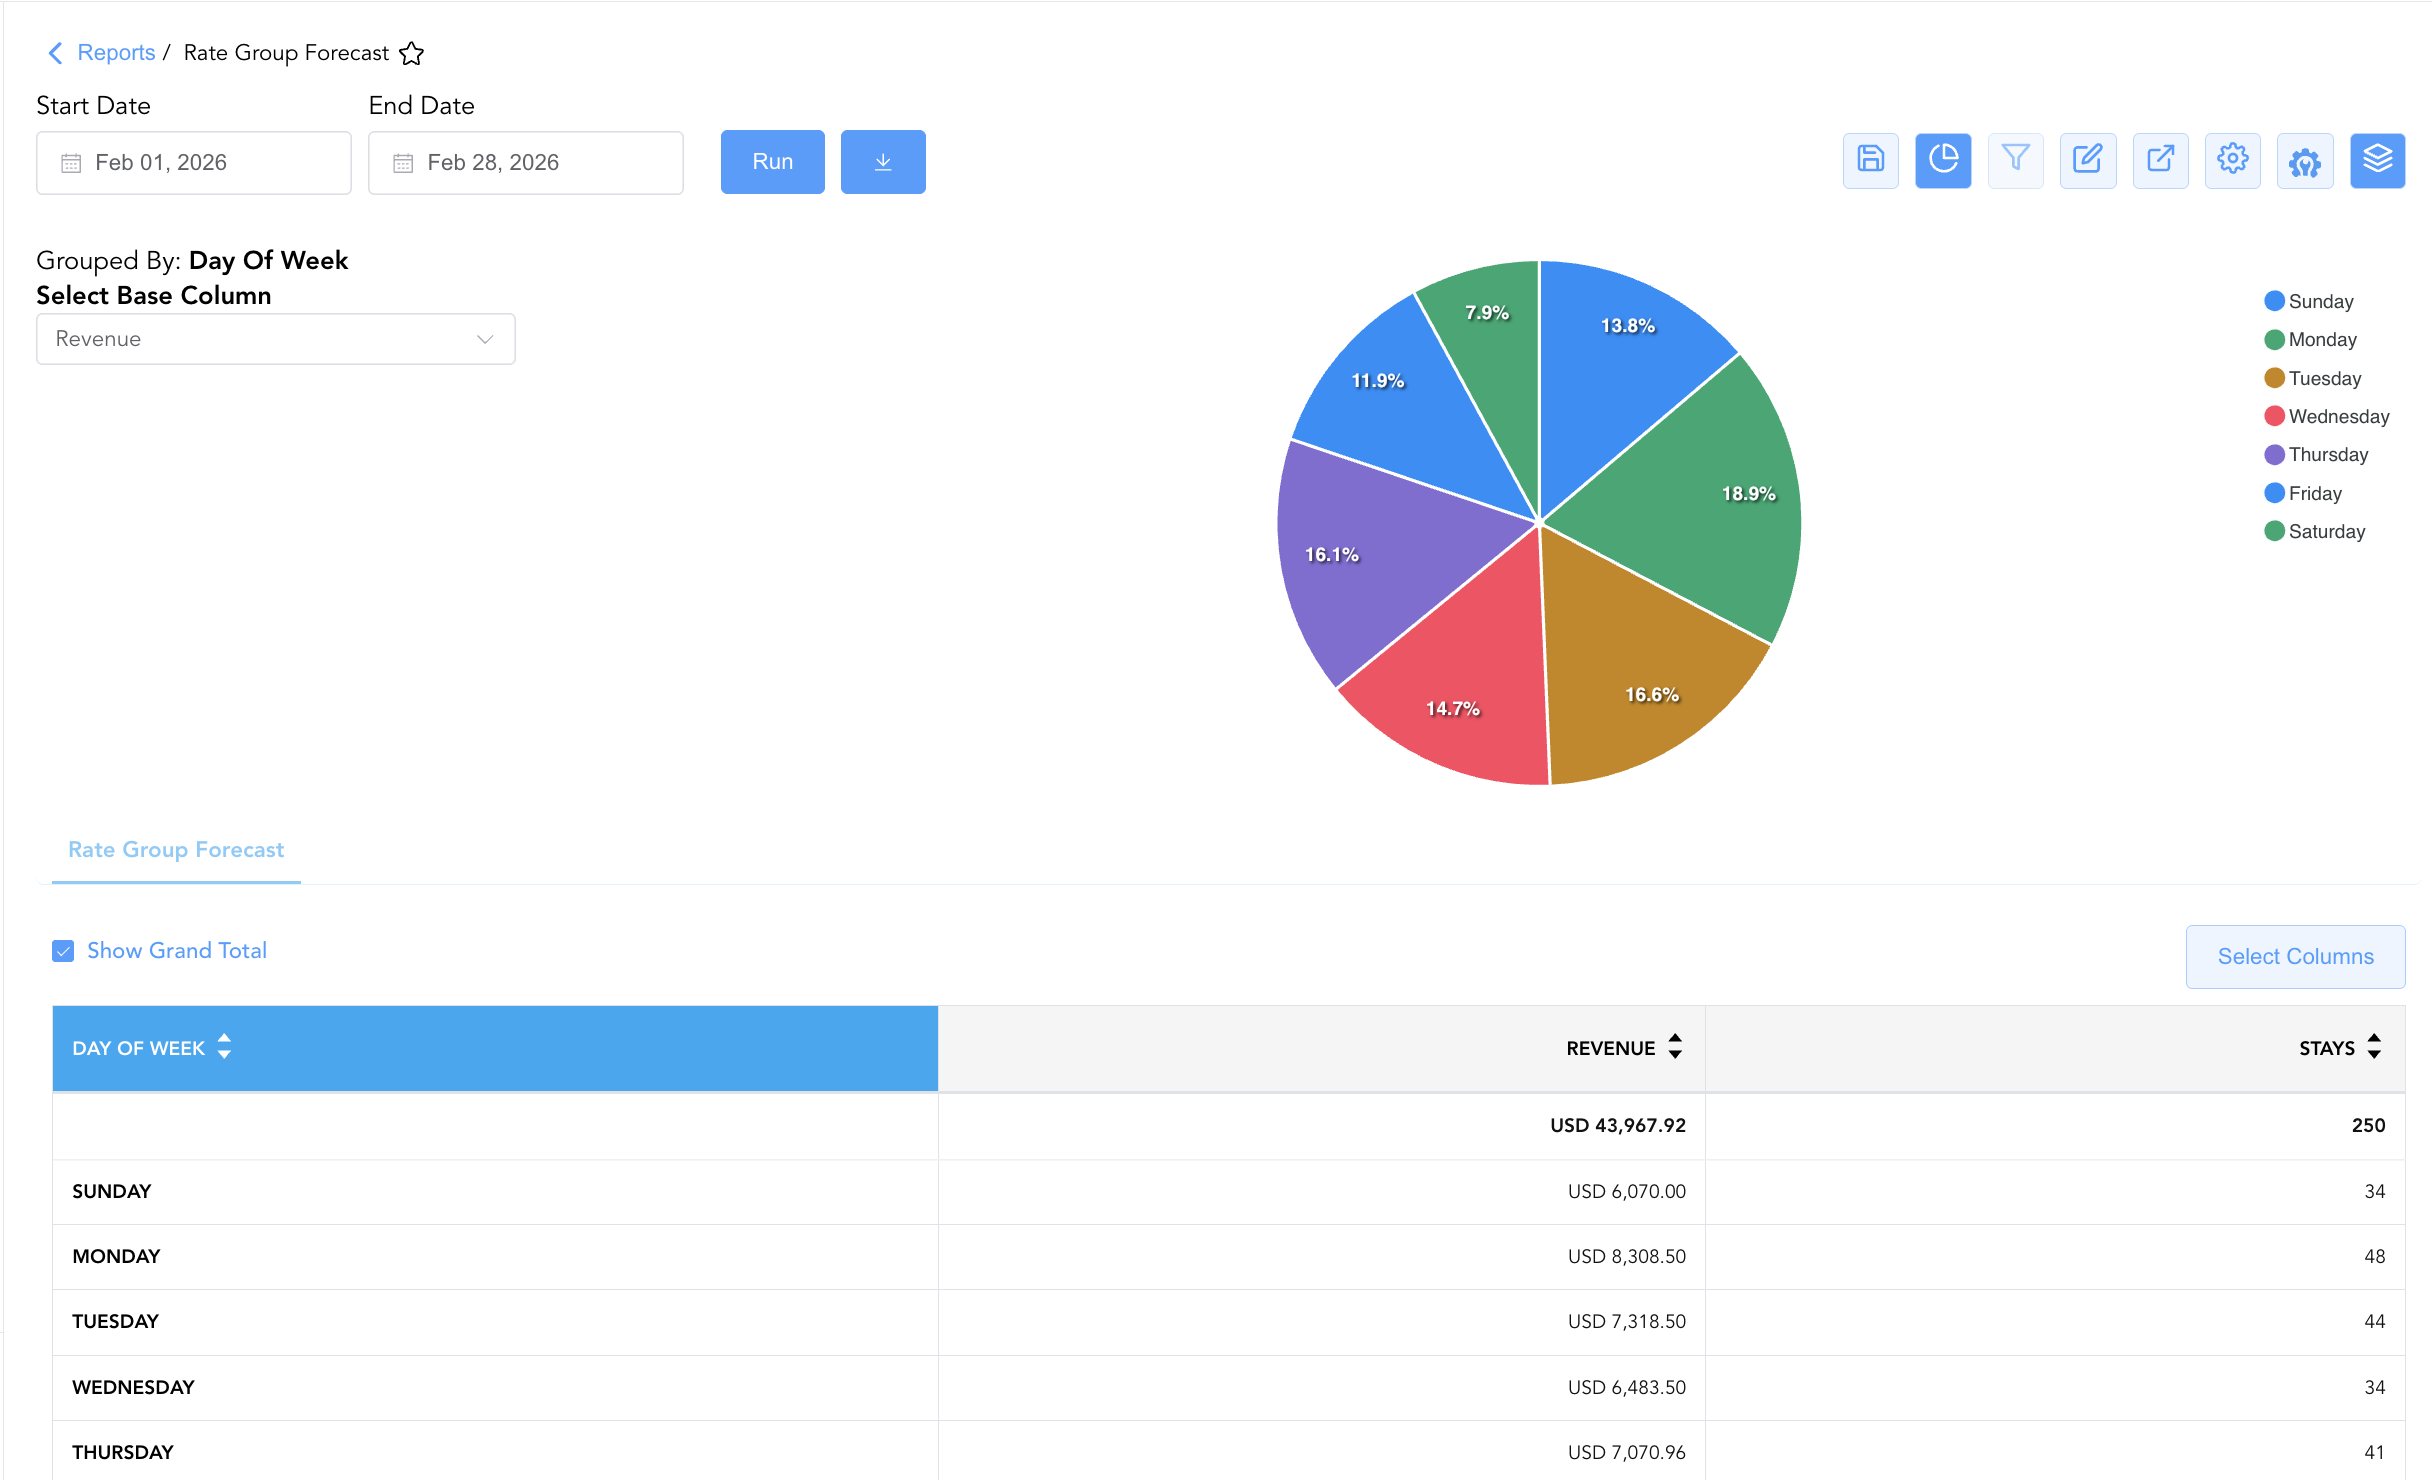
Group By & Pie Chart Visualization: The Rate Group Forecast report features an interactive pie chart to help analyze forward rate bucket production and projected revenue share distributions. Users can group forward rate performance entries on the fly by Rate Group Name or Day Of Week to evaluate bucket demand trends over future weekly or monthly horizons. By selecting either Revenue or Stays from the Select Base Column dropdown menu, the chart dynamically renders percentage share breakdowns accompanied by an interactive color-coded legend.
-
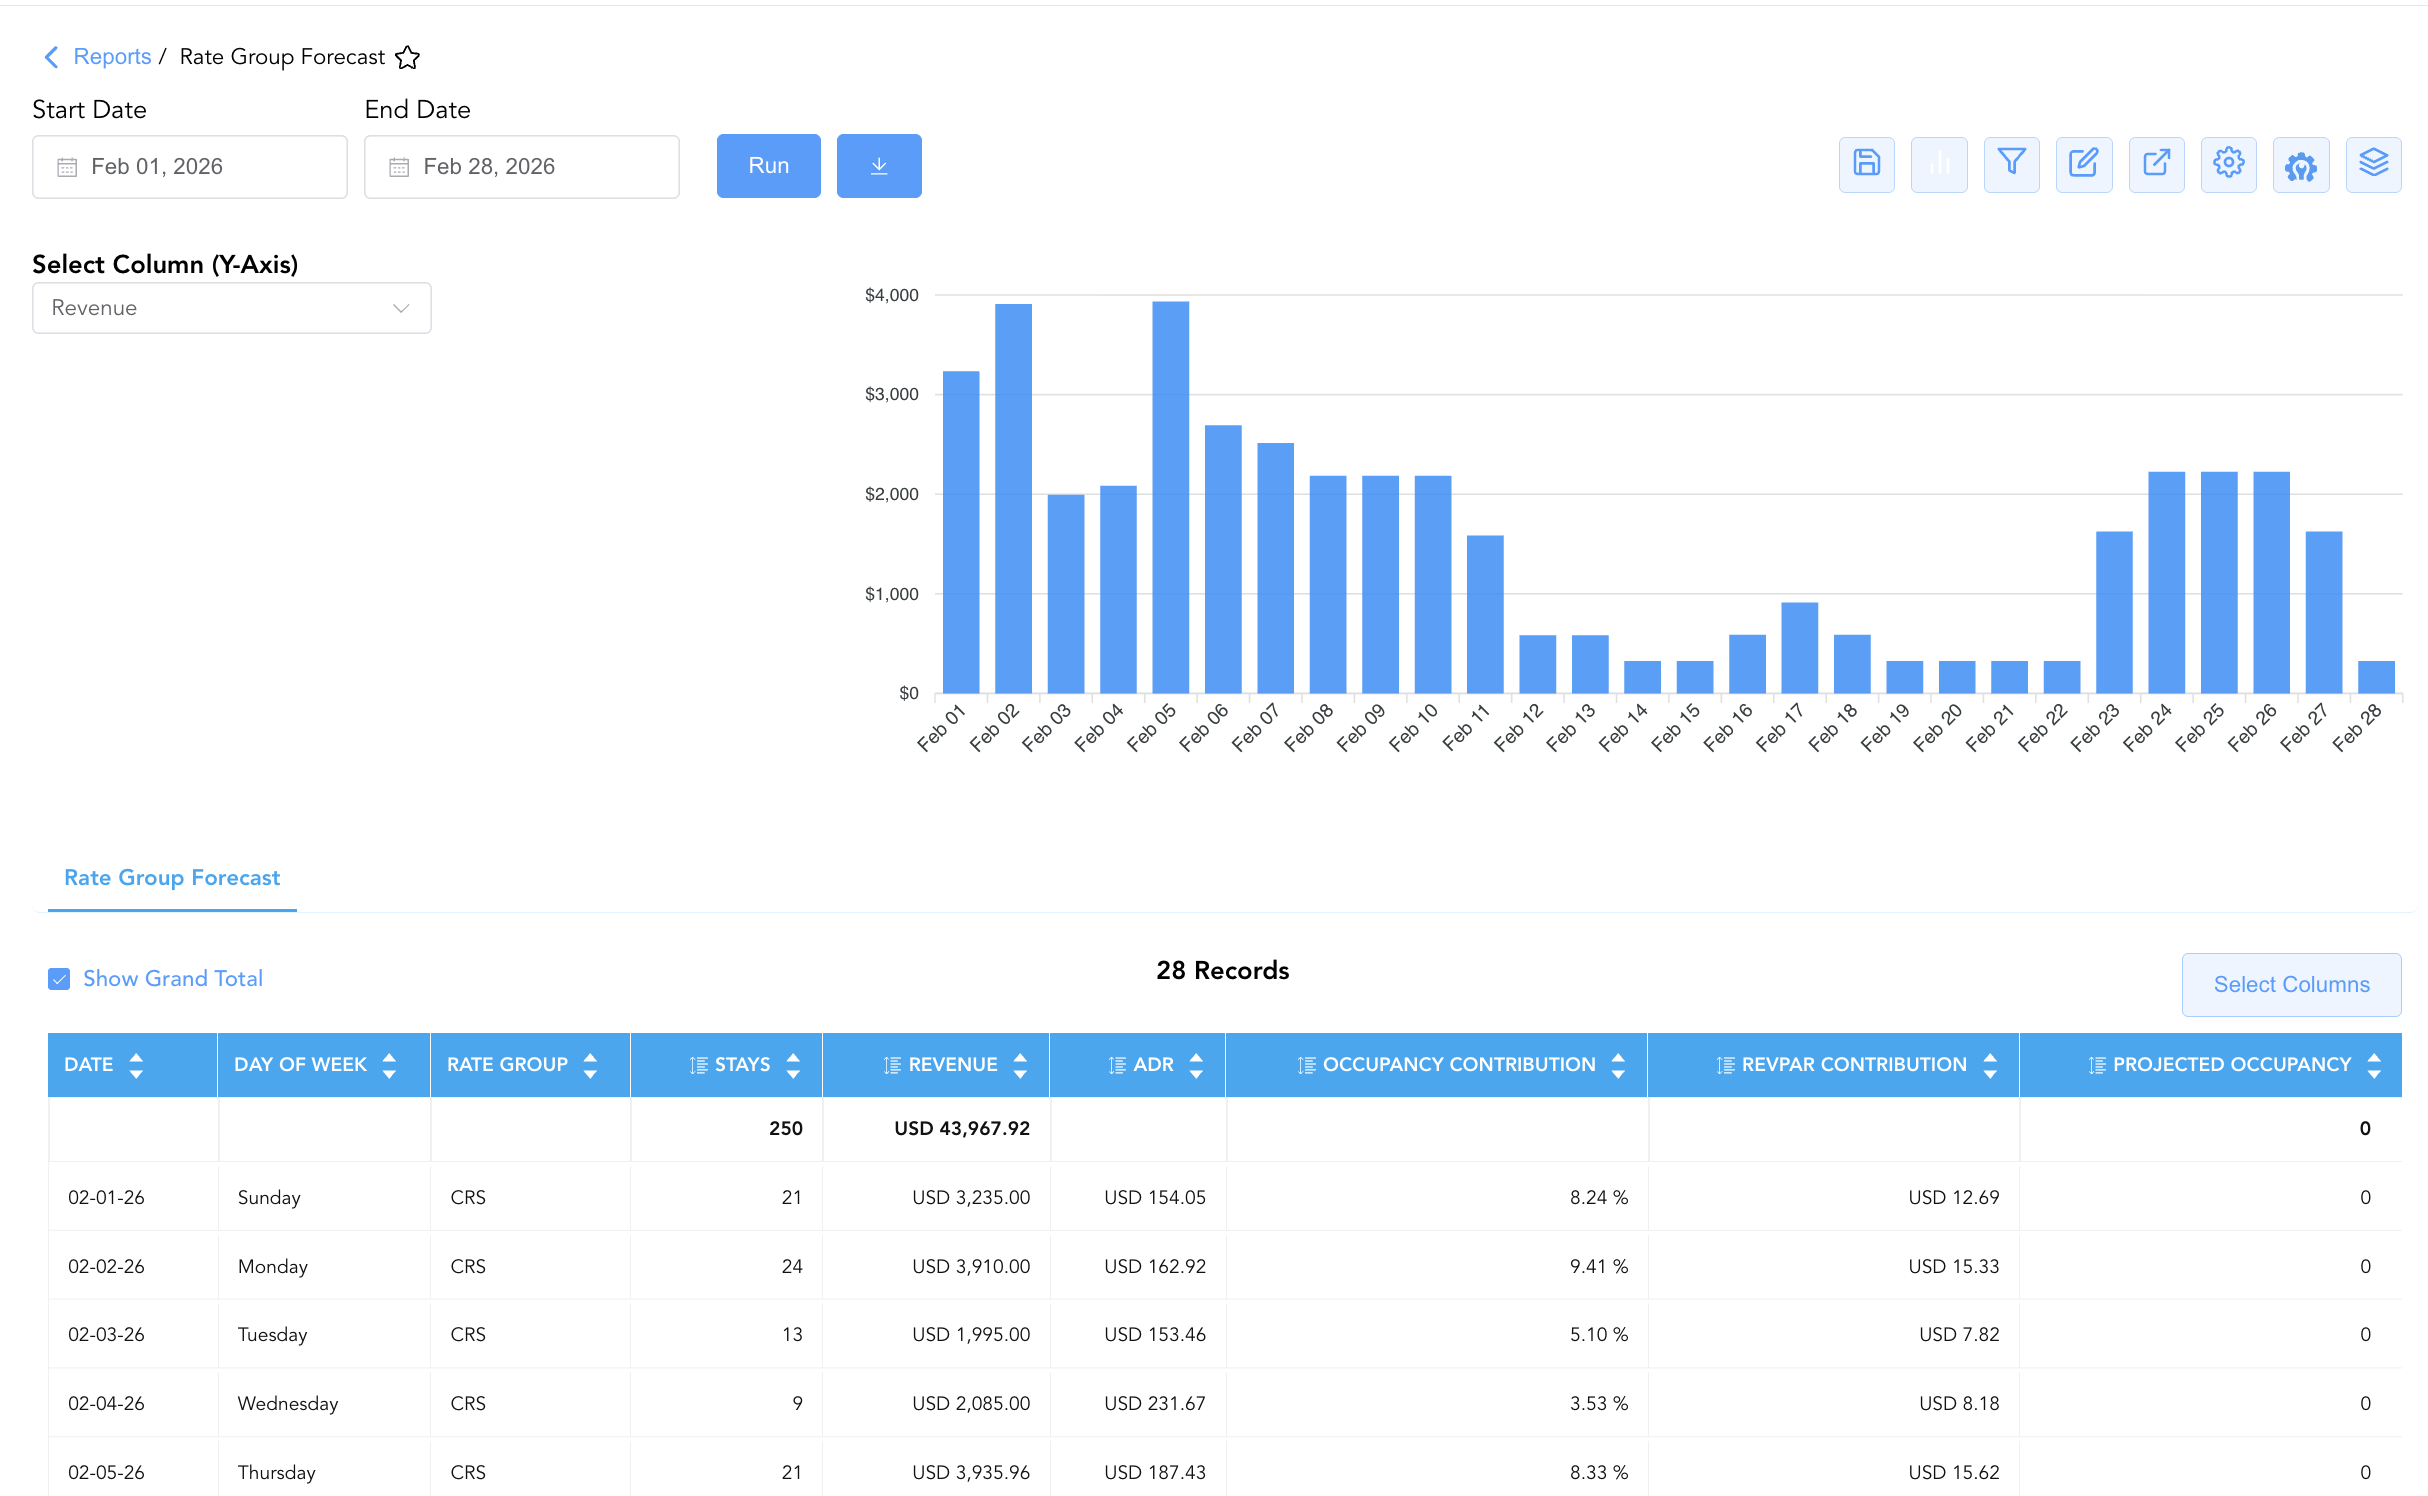
Bar Chart Visualizer: The Rate Group Forecast report includes an interactive bar chart to help visualize forward rate bucket demand and projected revenue trends over time. By adjusting the Select Column (Y-Axis) dropdown menu, users can dynamically toggle the chart view to plot metrics such as Revenue, Stays, or Projected Occupancy chronologically alongside the detailed forecast table.
Advanced Controls
-
Exporting & Rate Strategy Analysis: Download in Excel or PDF format to support weekly revenue strategy meetings, forward rate shopping evaluation, and HotelKey inventory control reviews.
-
Filtering: Filter data by specific
Rate Group(e.g., isolate CRS or Loyalty) or filter out zero-stay dates. -
Highlighting (Conditional Formatting): Apply custom rules to automatically highlight high-revenue projected stay dates or low-ADR performance periods.
🔗 Related Reports & Next Steps
Within 📈 Revenue & Analytics & 🔭 Yield & Forecasting:
-
Booking Pace – Multi-section tracking report evaluating pickup velocity across Revenue, Rooms Sold, ADR, and Occupancy.
-
Occupancy Forecast and History – Comprehensive daily overview tracking historical and forecasted occupancy, revenue, and movement counters.
-
Market Segment Details Forecast – Forward-looking demand forecast breakdown by market segment and rate code.
Cross-Pillar Deep Dives:
-
🏷️ Rate Management: Reconcile forward rate group projections against Rate Group Summary and Rate Code Configuration.
-
🥧 Market & Segmentation: Reconcile rate group projections against Market Segment Overview and Local Market Segment.