
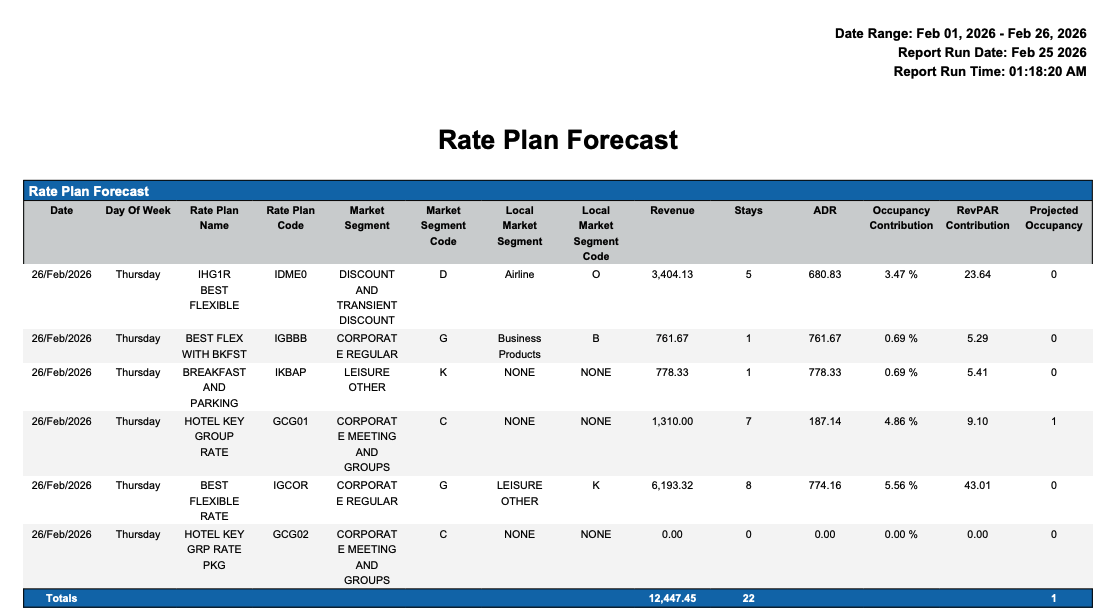
Report Description: The Forecast Report allows you to see how your future occupancy is distributed across specific rate plans and market segments.
Date Range: This report can render the data for up to 365 days in the past
Available Report Columns for the Following Sections:
|
Column Name |
Column Description |
Amount Includes Taxes and Fees |
Calculation |
|
Date |
Date for which the forecast is needed |
Not Applicable |
Not Applicable |
|
Day of the week |
Mentions the week day for the selected date |
Not Applicable |
Not Applicable |
|
Rate Plan Name Sort Rate Plan Name ascending |
Specifies the name of the rate plan considered for forecasting |
Not Applicable |
Not Applicable |
|
Rate Plan Code |
Code number associated with the rate plan selected |
Not Applicable |
Not Applicable |
|
Market Segment |
Mentions the group for which forecast is made eg - Corporate, Leisure et. |
Not Applicable |
Not Applicable |
|
Market Segment Code |
Code for the market segment |
Not Applicable |
Not Applicable |
|
Local Market Segment |
Mentions the local market for which forecast is made eg - Airline, Corporate et. |
Not Applicable |
Not Applicable |
|
Local Market Segment Code |
Code associated with the local market segment |
Not Applicable |
Not Applicable |
|
Revenue |
Revenue made in total |
Not Applicable |
Not Applicable |
|
Stays |
The total Number of stays in the category |
Not Applicable |
Not Applicable |
|
ADR |
Average Daily Rate |
Not Applicable |
Not Applicable |
|
Occupancy Contribution |
% - The contribution made by the selected rate plan with respect to occupancy |
Not Applicable |
Not Applicable |
|
RevPAR Contribution |
The total revenue per available room for the selected rate plan. |
Not Applicable |
Not Applicable |
|
Projected Occupancy |
% - The projection made against all the above parameters |
Not Applicable |
Not Applicable |
Misc Report Information:
Available Features:
-
Export: ability to download and save the file into an alternate format.
-
Filter: filter a range of data based on criteria defined by the user.
-
Highlight: also known as conditional formatting is the ability to highlight certain values making them easier to identify.
-
Bar Chart: ability to display data in a bar chart view.
-
Group By: ability to group data All, Transaction Code, Transaction Description or Transaction Type
Available Configuration:
-
User Preferences: allows the user to customize their report view by repositioning or removing columns.
-
Property Preferences: allows the property to customize the report view for all users by repositioning or removing columns.
Baseline Configuration:
-
Property Preferences Settings:
-
Following columns to be disabled for initial deployment:
-
None
-
-