
Booking Pace Report Overview
Parent Hub: 📈 Revenue & Analytics
Category: 🔭 Yield & Forecasting
Target Roles: Directors of Revenue Management, Revenue Analysts, General Managers, Asset Managers, Directors of Sales & Marketing
Key Value: Evaluate pickup dynamics and booking velocity over time, monitor daily progression across key revenue KPIs, track lead-time booking trends for future stay dates, and optimize dynamic pricing and yield strategies.
Executive Summary
The Booking Pace Report is a master forecasting and yield management document within the 🔭 Yield & Forecasting category of the 📈 Revenue & Analytics hub. Designed to deliver deep spatial and temporal intelligence on reservation pickup velocity, it tracks how room demand builds over time across future arrival dates.
-
By organizing pickup metrics into 4 defined report sections: Revenue, Room Sold, ADR, and Occupancy, this report enables revenue directors, general managers, and sales teams to analyze historical snapshot progression across future target stay dates, identify high-pickup booking windows, detect pricing resistance, and optimize dynamic rate strategies.
Key Capabilities
-
Four-Section Yield Analysis: Organizes booking velocity and pickup data into Revenue, Room Sold, ADR, and Occupancy sections for comprehensive multi-KPI pace tracking.
-
Snapshot Date Progression: Displays daily historical snapshot dates (
Date) down the rows, tracking cumulative booking growth for target stay dates across the columns. -
Multi-Date Target Horizon: Tracks pickup across a rolling 28+ day future horizon (e.g., target stay dates spanning Oct 09 through Nov 05), providing full forward-looking visibility.
-
Velocity & Pickup Identification: Enables revenue teams to compare snapshot dates (e.g., comparing Oct 09 snapshot vs. Oct 08 snapshot) to calculate net daily booking pickup.
-
Yield Strategy Validation: Helps validate pricing changes and promotional campaigns by monitoring corresponding impacts on room night volume, ADR, and occupancy percentage.
Report Views & Functional Breakdown
The Booking Pace Report presents forward-looking pickup metrics in a structured matrix across 4 defined sections:
┌────────────────────────────────────────────────────────────────────────┐
│                      BOOKING PACE REPORT                               │
├────────────────────────────────────────────────────────────────────────┤
│                       4 Defined Report Sections                        │
├──────────────────────────┬──────────────────────────┬──────────────────┤
│ 1. Revenue Pace Section  │ 2. Room Sold Section     │ 3. ADR Pace      │
│    (Gross Room Revenue)  │    (Physical Stay Volume)│    Section       │
├──────────────────────────┴──────────────────────────┴──────────────────┤
│ 4. Occupancy Pace Section (Occupancy Percentage Share)                 │
└────────────────────────────────────────────────────────────────────────┘
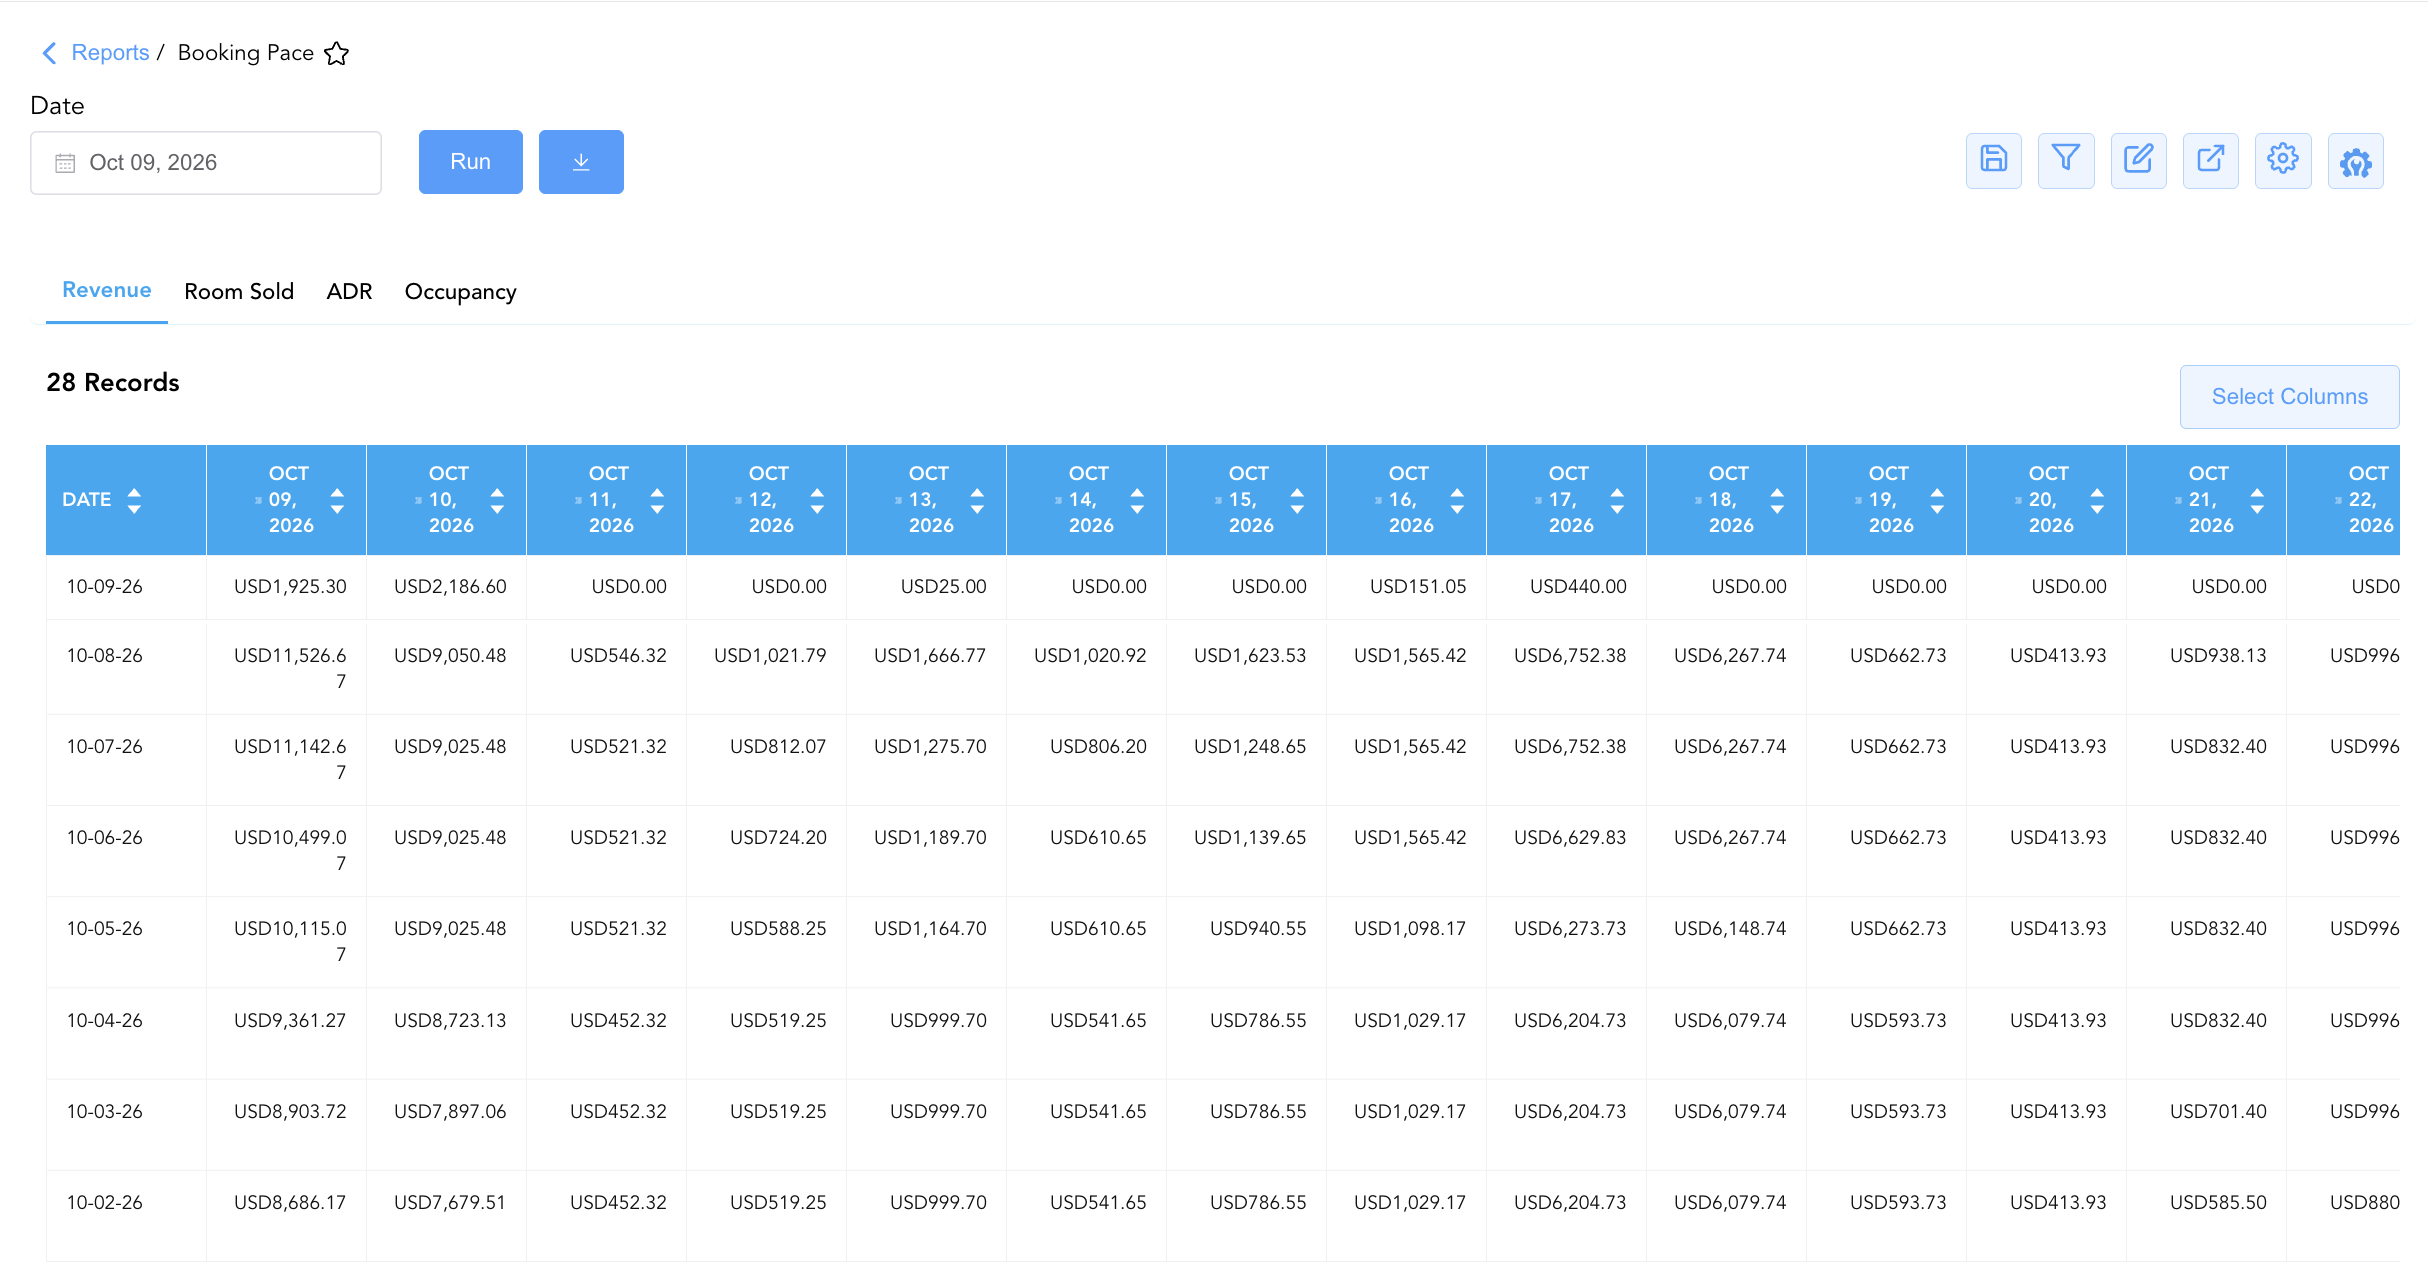
1. Revenue Pace Section
Monitors cumulative gross room revenue booked as of each historical snapshot date for future target stay dates.
-
Primary Use: Evaluating revenue build pace, tracking revenue pickup velocity, and identifying peak revenue-generating stay dates.
-
Key Metrics: Snapshot Date, Target Stay Dates (Columns), Cumulative Room Revenue ($).
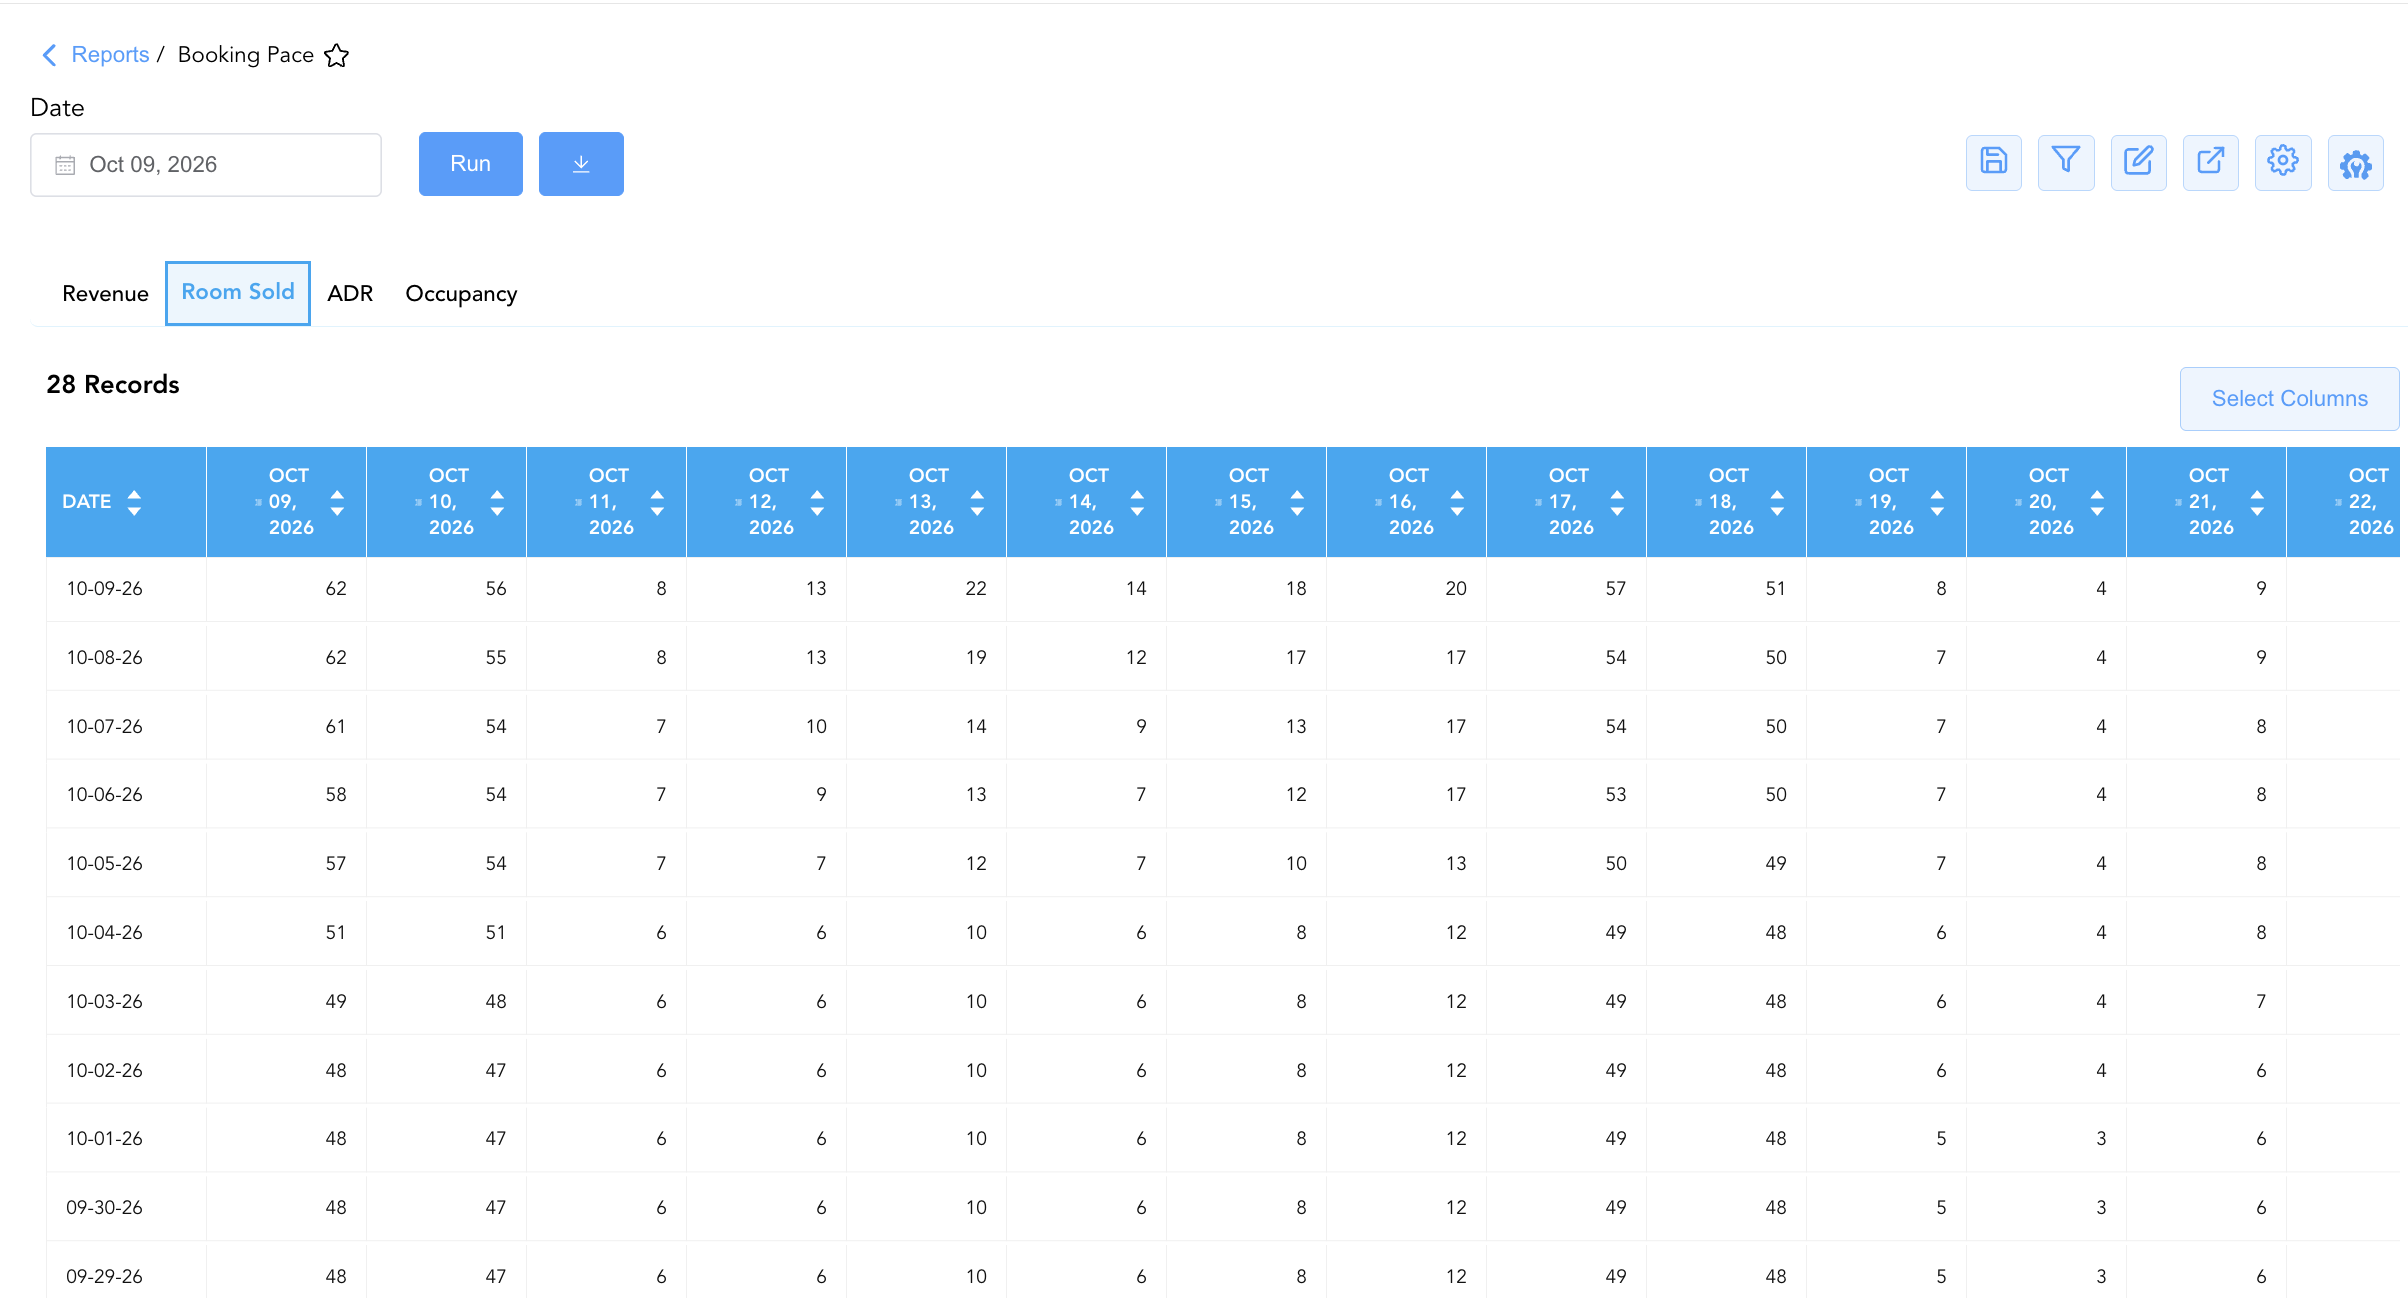
2. Room Sold Section
Tracks physical room night volume booked as of each snapshot date for future target stay dates.
-
Primary Use: Measuring physical room night pickup, evaluating occupancy build velocity, and monitoring group and transient block pickup.
-
Key Metrics: Snapshot Date, Target Stay Dates (Columns), Total Rooms Sold (Units).
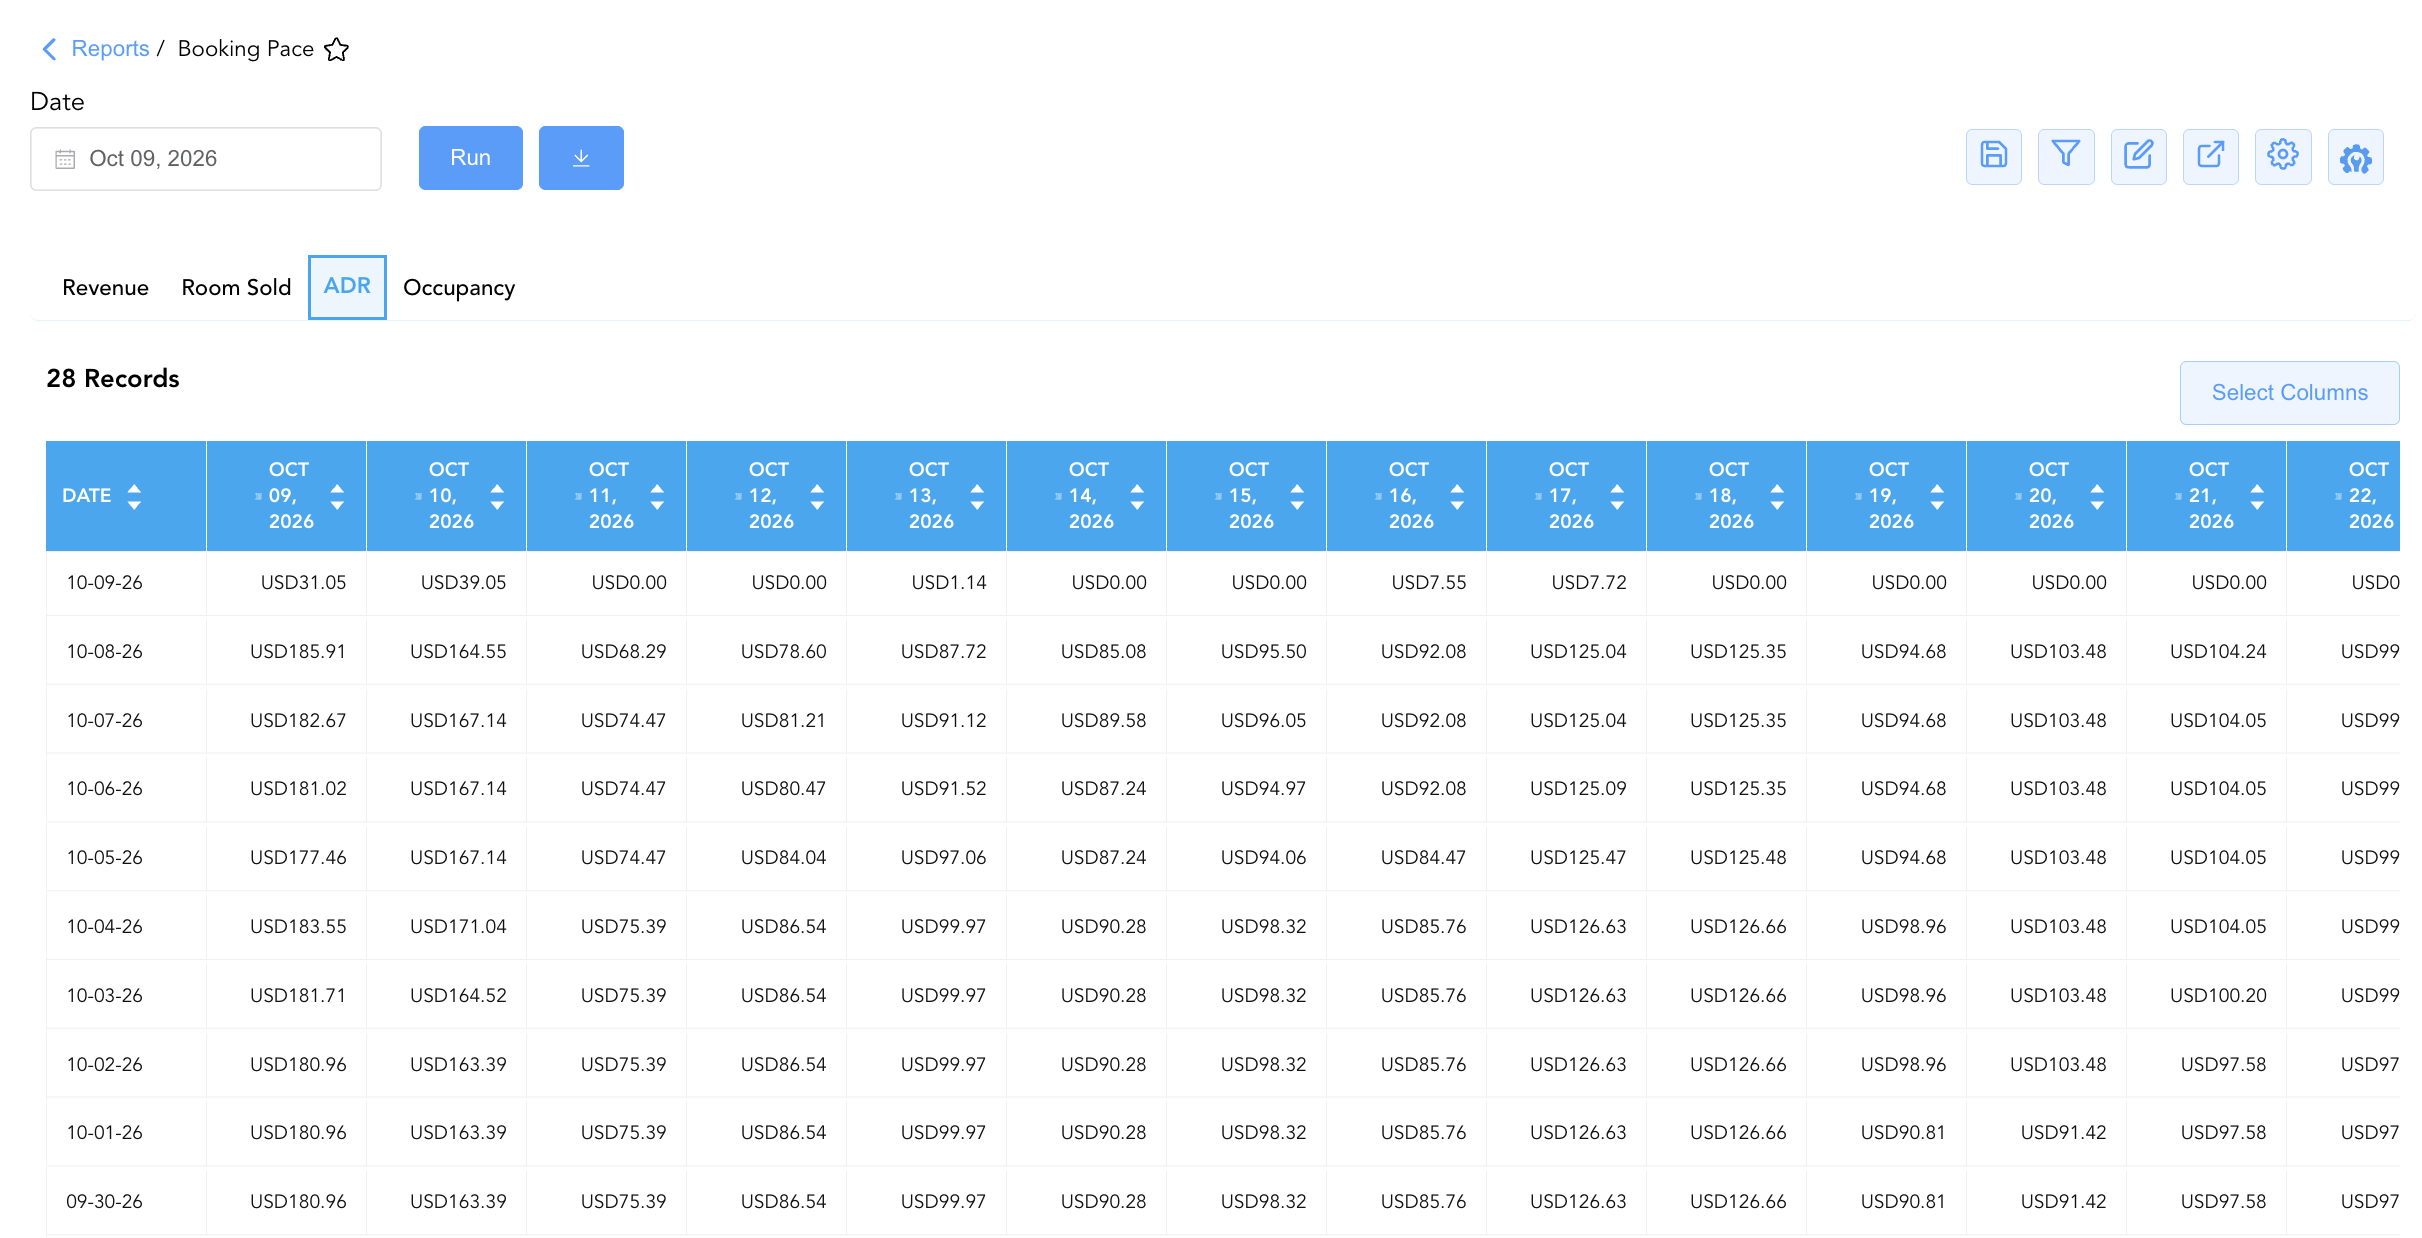
3. ADR Pace Section
Monitors realized Average Daily Rate (ADR) as of each snapshot date for future target stay dates.
-
Primary Use: Auditing rate yield progression over time, detecting price dilution or rate increases as stay dates approach, and evaluating rate fence performance.
-
Key Metrics: Snapshot Date, Target Stay Dates (Columns), Average Daily Rate (Revenue ÷ Rooms Sold).
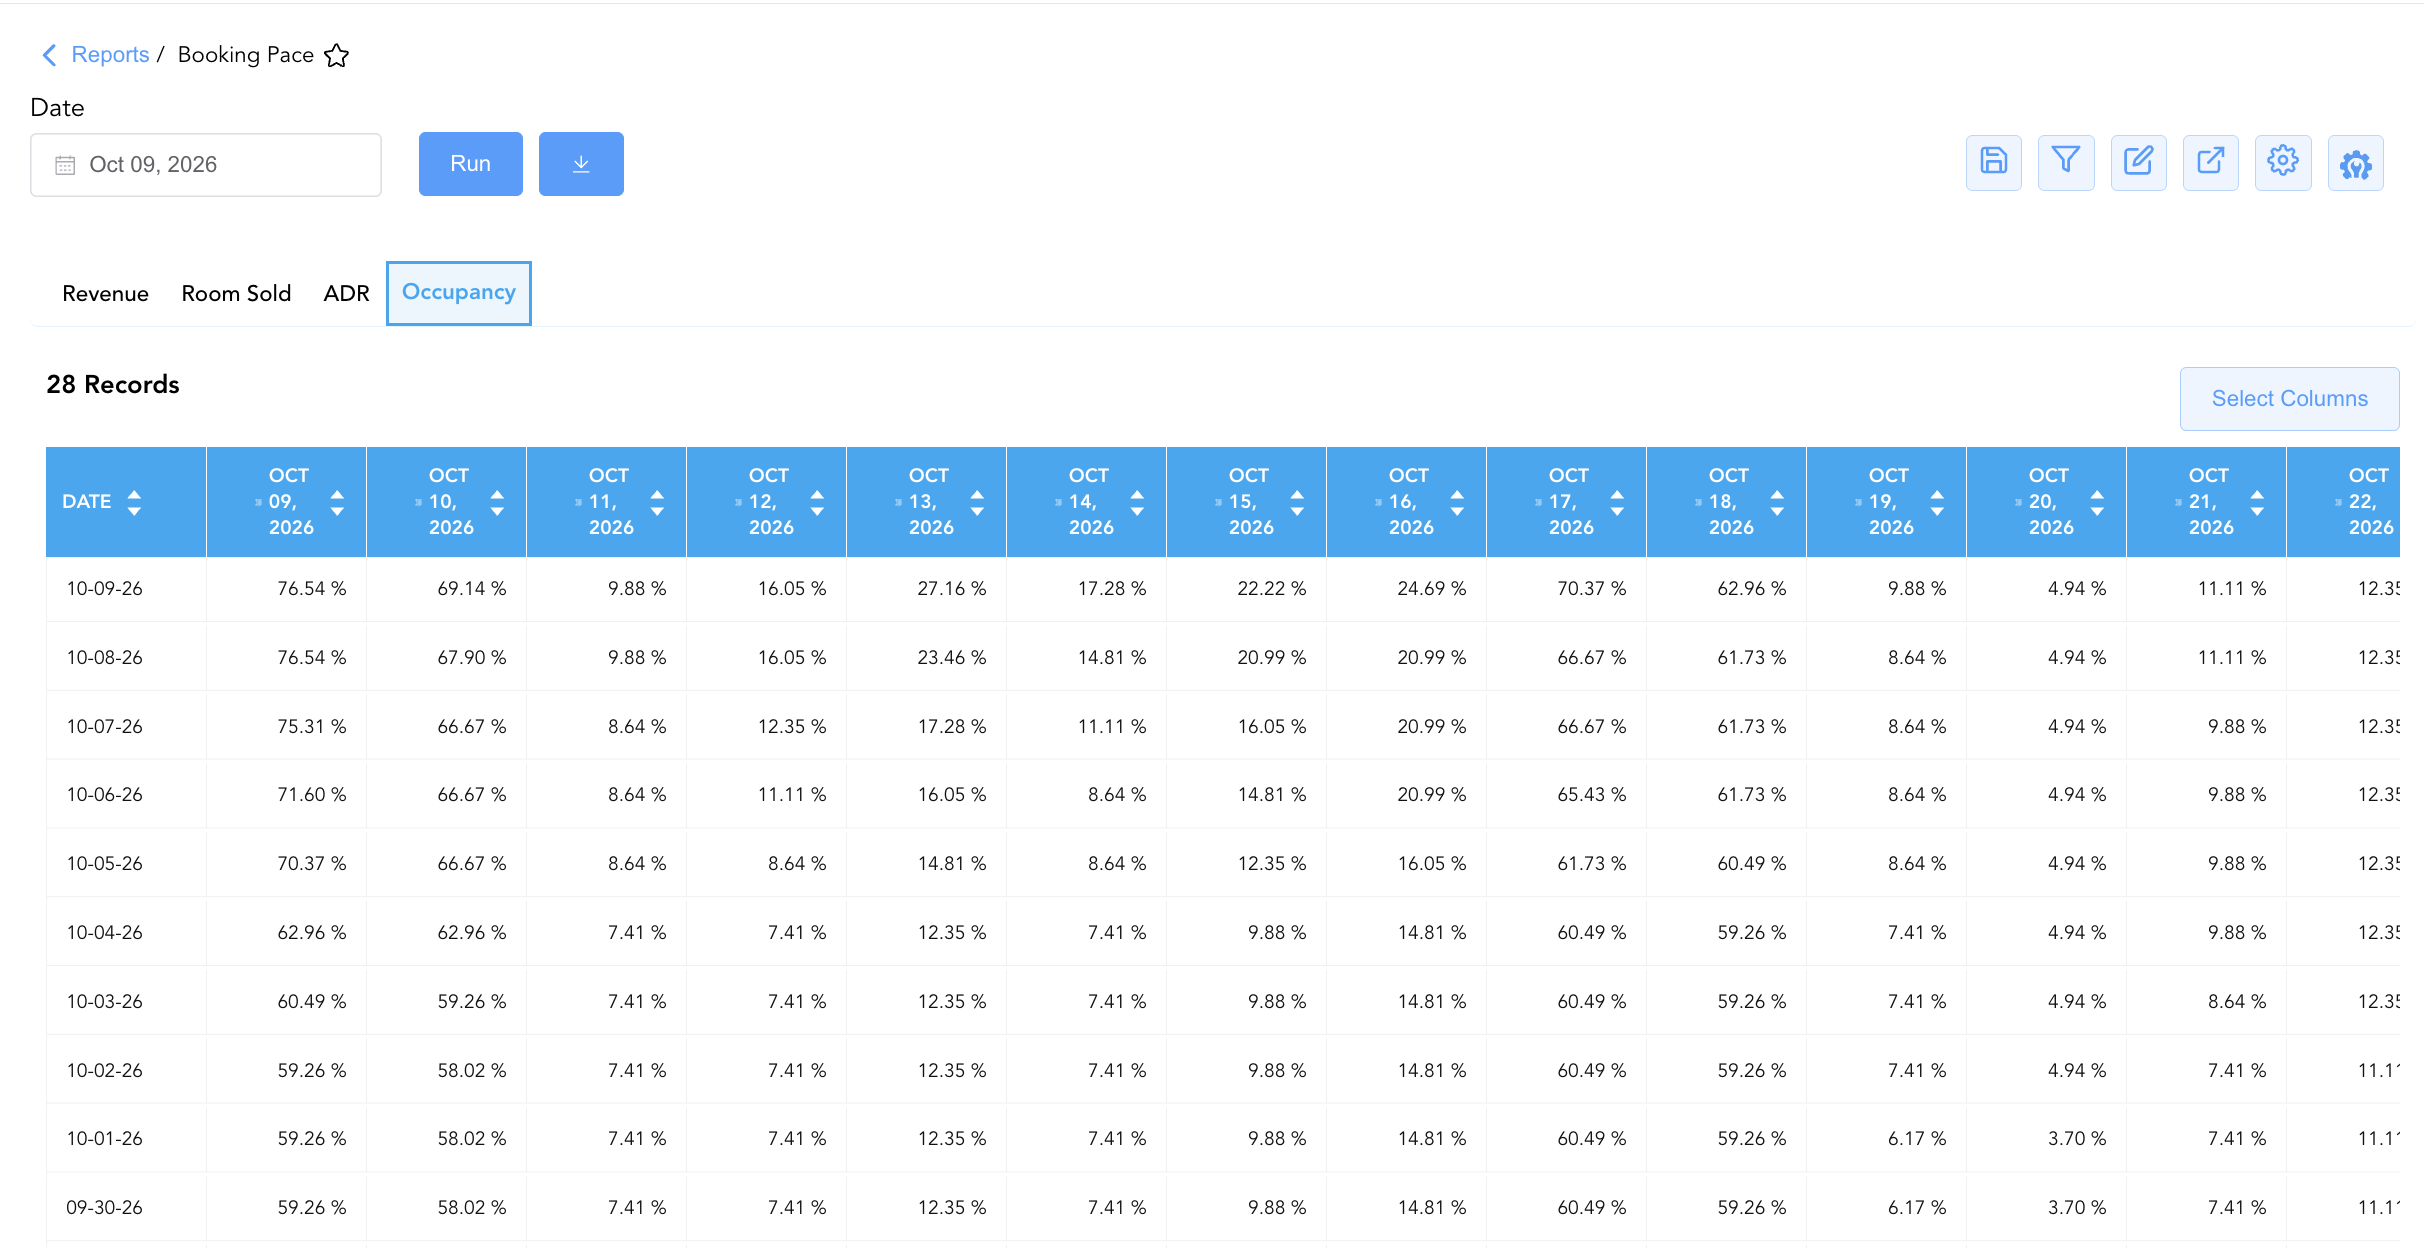
4. Occupancy Pace Section
Displays cumulative occupancy percentage achieved as of each snapshot date for future target stay dates.
-
Primary Use: Tracking capacity fulfillment share against total available hotel room inventory, identifying low-occupancy dates requiring promotional yield pushes, and benchmarking shoulder-date pickup.
-
Key Metrics: Snapshot Date, Target Stay Dates (Columns), Occupancy Percentage (Rooms Sold ÷ Total Capacity).
Data Dictionary (Dynamic View Columns)
Customize your default view using the Configure (⚙️) icon on the report page. Below is the full data dictionary representing every column available in this report:
💡 Pace & Matrix Calculation Note: The report structure features snapshot booking dates down the primary row axis, with target future stay dates arranged across the horizontal column matrix. Values in the matrix represent cumulative totals recorded as of the snapshot date.
|
Column Name |
Description |
Data Source / System Mapping |
Includes Taxes & Fees? |
|
Date (Row Axis) |
Historical snapshot date on which the booking pace data was captured (e.g., 2026-10-09, 2026-10-08). |
Reservation Audit Trail > Snapshot Date |
N/A |
|
Target Stay Dates (Column Matrix) |
Individual future calendar dates for which booking pace is being tracked (e.g., Oct 09, Oct 10, ... Nov 05). |
Reservation System > Target Stay Date |
N/A |
|
Revenue Matrix Values |
Cumulative base room revenue booked as of the snapshot date for the target stay date. |
SUM(Base Room Revenue as of Snapshot) |
❌ No |
|
Room Sold Matrix Values |
Cumulative physical room nights booked as of the snapshot date for the target stay date. |
SUM(Occupied Rooms as of Snapshot) |
N/A |
|
ADR Matrix Values |
Average Daily Rate achieved as of the snapshot date (Revenue ÷ Room Sold). |
Revenue / Room Sold |
❌ No |
|
Occupancy Matrix Values |
Occupancy percentage achieved as of the snapshot date (Room Sold ÷ Total Capacity). |
Room Sold / Total Hotel Capacity |
N/A |
Customization & Platform Features
User & Property Preferences
-
Personal Preference: Tailor your individual view by hiding or dragging columns. Your preferences save automatically for future sessions.
-
Property Defaults: System Admins can configure standard default layouts across all property users to streamline operational reporting. To maximize audit efficiency, group the columns into the below logical blocks.
-
Section 1: Revenue
-
Snapshot Date Anchor (Col 1):
As-Of Snapshot Date -
Forward Stay Date Columns (Cols 2–29):
Target Stay Date Revenue(Oct 09, 2026throughNov 05, 2026)
-
-
Section 2: Rooms Sold
-
Snapshot Date Anchor (Col 1):
As-Of Snapshot Date -
Forward Stay Date Columns (Cols 2–29):
Target Stay Date Rooms Sold(Oct 09, 2026throughNov 05, 2026)
-
-
Section 3: Average Daily Rate (ADR)
-
Snapshot Date Anchor (Col 1):
As-Of Snapshot Date -
Forward Stay Date Columns (Cols 2–29):
Target Stay Date ADR(Oct 09, 2026throughNov 05, 2026)
-
-
Section 4: Occupancy
-
Snapshot Date Anchor (Col 1):
As-Of Snapshot Date -
Forward Stay Date Columns (Cols 2–29):
Target Stay Date Occupancy %(Oct 09, 2026throughNov 05, 2026)
-
-
Report Toolbar & Quick Actions
Use the top-right toolbar icons on the report page to manage and export your data view:
|
Icon |
Action / Feature |
Description |

|
Knowledge Article |
Opens the knowledge base article to learn how to interpret this report. |

|
Saved Views |
Saves your column filtering, sorting, and highlight preferences so you can easily reload your custom view later without reconfiguring the report. |

|
Filter |
Opens filter controls to isolate specific data within a column based on your selected criteria. |

|
Highlight |
Highlights column values in a designated color based on selected conditions. |

|
Export |
Exports and downloads the report in various formats (Excel, PDF, CSV) for offline analysis or printing. |

|
Configure |
Opens column selection controls to toggle visibility, reorder columns, or hide rows with all zeros. |

|
Additional Configuration |
Provides advanced report configuration and display formatting options to customize data presentation. |
Advanced Controls
-
Exporting & Forecast Analysis: Download in Excel or PDF format to support weekly revenue strategy meetings, demand forecasting models, and owner presentation decks.
-
Filtering: Filter data by specific snapshot date ranges or isolate key event dates.
-
Highlighting (Conditional Formatting): Apply custom rules to automatically highlight high-pickup snapshot intervals or flag lagging target stay dates.
🔗 Related Reports & Next Steps
Within 📈 Revenue & Analytics & 🔭 Yield & Forecasting:
-
Market Segment Details Forecast – Forward-looking demand forecast breakdown by market segment and rate code.
-
Length of Stay Statistics – Analysis of stay duration patterns and minimum stay rule impact on property yield.
-
Rate Plan Summary – Comprehensive overview evaluating daily and period-to-date revenue performance across individual rate plans.
Cross-Pillar Deep Dives:
-
🥧 Market & Segmentation: Reconcile forward booking pace against Market Segment Overview and Local Market Segment.
-
⚖️ Ledgers & Trial Balance: Reconcile historical room revenue postings against General Ledger control accounts in Trial Balance.