
Net Revenue Report Overview
Parent Hub: 📈 Revenue & Analytics
Category: 📊 Performance Summaries
Target Roles: Directors of Finance & Controllers, Directors of Revenue Management, General Managers, Financial Analysts, Accounting Staff
Key Value: Audit daily property-wide net revenue realizations across primary operational charge categories, evaluate non-room revenue stream performance, and support Month-to-Date general ledger tie-outs.
Executive Summary
The Net Revenue Report is a primary financial audit and revenue performance document within the 📊 Performance Summaries category of the 📈 Revenue & Analytics hub. Designed to provide daily net revenue visibility across all active departmental revenue streams, it aggregates daily ledger postings after applying write-offs, allowances, and tax exclusions to present net realized income across the property.
By mapping business dates (Date, Day of Week) across all primary revenue posting classifications—including accommodation revenue (Room Rent), incidental fee charges (Misc Charge), food sales (Food), beverage sales (Beverage), event/banquet fees (Event), laundry services (Laundry), telecommunications (Phone), non-room miscellaneous income (Other), system adjustments (System), non-taxable/non-revenue postings (Non Revenue), and advance deposit releases (Advance Deposit)—this report enables controllers and revenue managers to evaluate daily net earning trends, verify non-room revenue contributions, and reconcile Month-to-Date revenue totals against general ledger control accounts.
Key Capabilities
-
Daily Multi-Departmental Net Matrix: Summarizes daily net revenue realizations across 11 distinct operational revenue categories in a clean date-by-date matrix layout.
-
Core vs. Ancillary Revenue Audit: Separates core room accommodation income (Room Rent) from ancillary food and beverage (Food, Beverage) and incidental departmental charges (Misc Charge, Laundry, Event).
-
Non-Revenue & Advance Deposit Tracking: Monitors non-revenue ledger postings (Non Revenue) and deposit clearing activity (Advance Deposit) to ensure complete balance sheet auditability.
Report Views & Functional Breakdown
The Net Revenue Report presents property revenue realization in a unified daily matrix structure that supports three distinct analytical perspectives:
┌────────────────────────────────────────────────────────────────────────┐
│                        NET REVENUE REPORT                              │
├────────────────────────────────────────────────────────────────────────┤
│                         Daily Matrix View                              │
├──────────────────────────┬──────────────────────────┬──────────────────┤
│ 1. Rooms & Core          │ 2. Food, Beverage &      │ 3. Non-Revenue &  │
│    Accommodation Revenue │    Outlet Realizations   │    Deposit Audit │
└──────────────────────────┴──────────────────────────┴──────────────────┘
1. Rooms & Core Accommodation Revenue
Monitors daily net room rental realizations alongside incidental fee postings across the operating month.
-
Primary Use: Tracking net accommodation earning trends, evaluating daily rate realizations, and auditing room-adjacent incidental fee charges.
-
Key Metrics: Date, Day of Week, Room Rent, Misc Charge.
2. Food, Beverage & Outlet Realizations
Aggregates net revenue generated across dining outlets, bars, in-room dining, and banqueting operations.
-
Primary Use: Measuring food and beverage sales contributions to total property yield and evaluating day-of-week outlet performance patterns.
-
Key Metrics: Date, Day of Week, Food, Beverage, Event, Laundry, Phone, Other.
3. Non-Revenue & Deposit Audit
Tracks non-revenue postings, system adjustments, and advance deposit clearing entries.
-
Primary Use: Reconciling non-revenue ledger activity during night audit close and verifying advance deposit releases against balance sheet accounts.
-
Key Metrics: Date, Day of Week, System, Non Revenue, Advance Deposit.
.png?cb=54f6376100c11873903d5f5101701e39)
Data Dictionary (Dynamic View Columns)
Customize your default view using the Configure (⚙️) icon on the report page. Below is the full data dictionary representing every column available in this report:
💡 Monetary Treatment Note: All monetary values across revenue columns represent Net Realized Financial Amounts (Excludes Statutory Taxes & Mandatory Fees). Positive values indicate net revenue earned, while negative values indicate net allowance write-offs or debit adjustments.
|
Column Name |
Description |
Data Source / System Mapping |
Includes Taxes & Fees? |
|
Date |
Official business date for which net revenue realizations are summarized. |
System Business Date |
N/A |
|
Day of Week |
Calendar day of the week corresponding to the business date (e.g., Wednesday, Thursday). |
System Calendar Engine |
N/A |
|
Room Rent |
Net realized room accommodation revenue earned from guest stays and day-use bookings. |
|
❌ No |
|
Misc Charge |
Net incidental fees and ancillary room charges (e.g., parking, early check-in, late checkout fees). |
|
❌ No |
|
System |
Net revenue adjustments generated automatically by system interface rules. |
System Ledger Engine |
❌ No |
|
Food |
Net food revenue earned across restaurants, in-room dining, and catering/banquet operations. |
|
❌ No |
|
Event |
Net venue rental, function room setup, and event facility fees. |
|
❌ No |
|
Laundry |
Net guest laundry, valet, and dry cleaning service earnings. |
|
❌ No |
|
Phone |
Net telecommunication and guest room phone call service charges. |
|
❌ No |
|
Non Revenue |
Postings classified as non-revenue accounting transactions (e.g., pass-through items, security holds). |
Non-Revenue Ledger Engine |
❌ No |
|
Advance Deposit |
Advance purchase deposits cleared and recognized during the business date. |
Advance Deposit Sub-Ledger |
❌ No |
|
Beverage |
Net alcoholic and non-alcoholic beverage sales realized across bars and dining outlets. |
|
❌ No |
|
Other |
Net miscellaneous departmental earnings not classified under standard outlet codes. |
General Miscellaneous Ledger |
❌ No |
Customization & Platform Features
User & Property Preferences
-
Personal Preference: Tailor your individual view by hiding or dragging columns. Your preferences save automatically for future sessions.
-
Property Defaults: System Admins can configure standard default layouts across all property users to streamline operational reporting. To maximize audit efficiency, group the columns into 6 logical blocks:
-
Audit Timeline (Cols 1–2):
Date|Day of Week -
Primary Accommodation Revenue (Col 3):
Room Rent -
Food & Beverage Outlets (Cols 4–5):
Food|Beverage -
Ancillary Guest Services (Cols 6–9):
Event|Laundry|Phone|Other -
Non-Revenue & Advance Deposit Ledgers (Cols 10–11):
Non Revenue|Advance Deposit -
System & Misc Adjustments (Cols 12–13):
Misc Charge|System
-
Report Toolbar & Quick Actions
Use the top-right toolbar icons on the report page to manage and export your data view:
|
Icon |
Action / Feature |
Description |

|
Knowledge Article |
Opens the knowledge base article to learn how to interpret this report. |

|
Background Export |
Allows users to download up to 365 days of data directly to their computer in CSV format. |

|
Saved Views |
Saves your column filtering, sorting, and highlight preferences so you can easily reload your custom view later without reconfiguring the report. |

|
Bar Chart |
Displays report data in a visual bar chart format. |

|
Filter |
Opens filter controls to isolate specific data within a column based on your selected criteria. |

|
Highlight |
Highlights column values in a designated color based on selected conditions. |

|
Export |
Exports and downloads the report in various formats (Excel, PDF, CSV) for offline analysis or printing. |

|
Configure |
Opens column selection controls to toggle visibility, reorder columns, or hide rows with all zeros. |

|
Additional Configuration |
Provides advanced report configuration and display formatting options to customize data presentation. |

|
Group By |
Summarize and group report data dynamically in real time. |
Interactive Visualizations & Grouping Controls
-
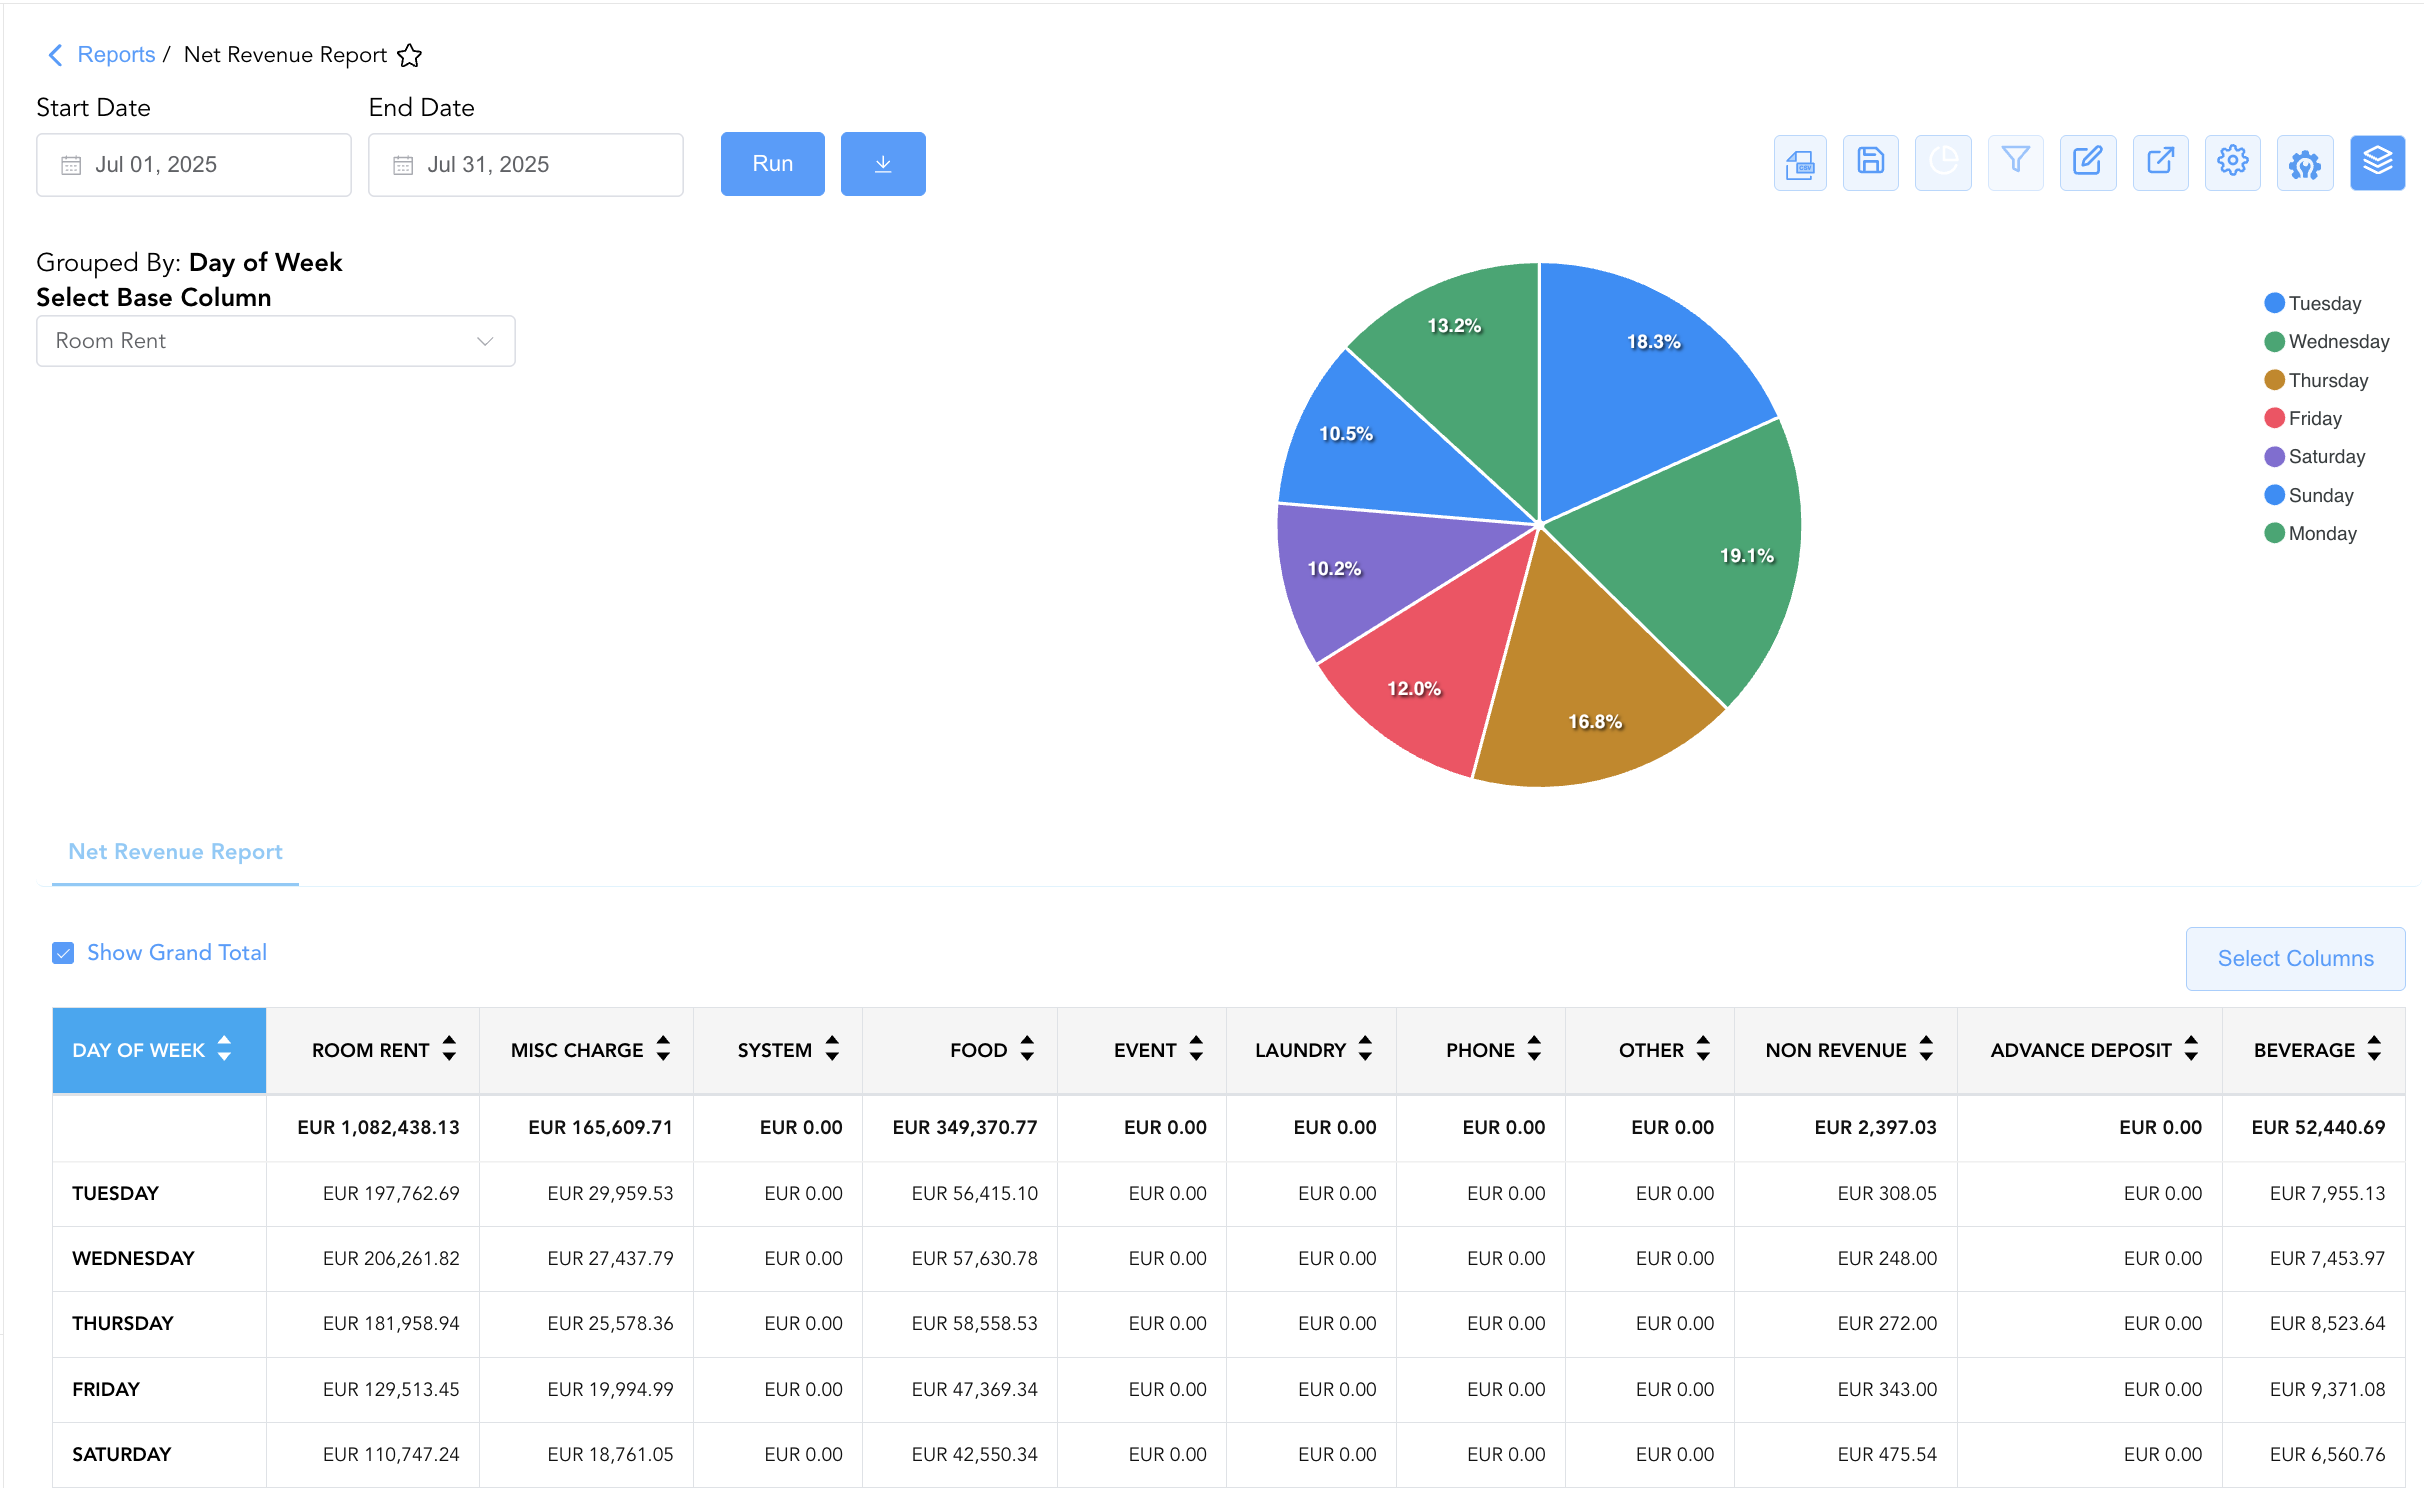
Group By & Pie Chart Visualization: The Net Revenue Report features an interactive pie chart to analyze revenue distribution and variance patterns across the week. Users can group matrix entries on the fly by Day of Week to evaluate day-of-week revenue variance trends. By selecting a metric from the Select Base Column dropdown menu—such as Room Rent, Food, Event, or Misc Charge—the chart dynamically displays percentage contribution share alongside an interactive color-coded legend.
-
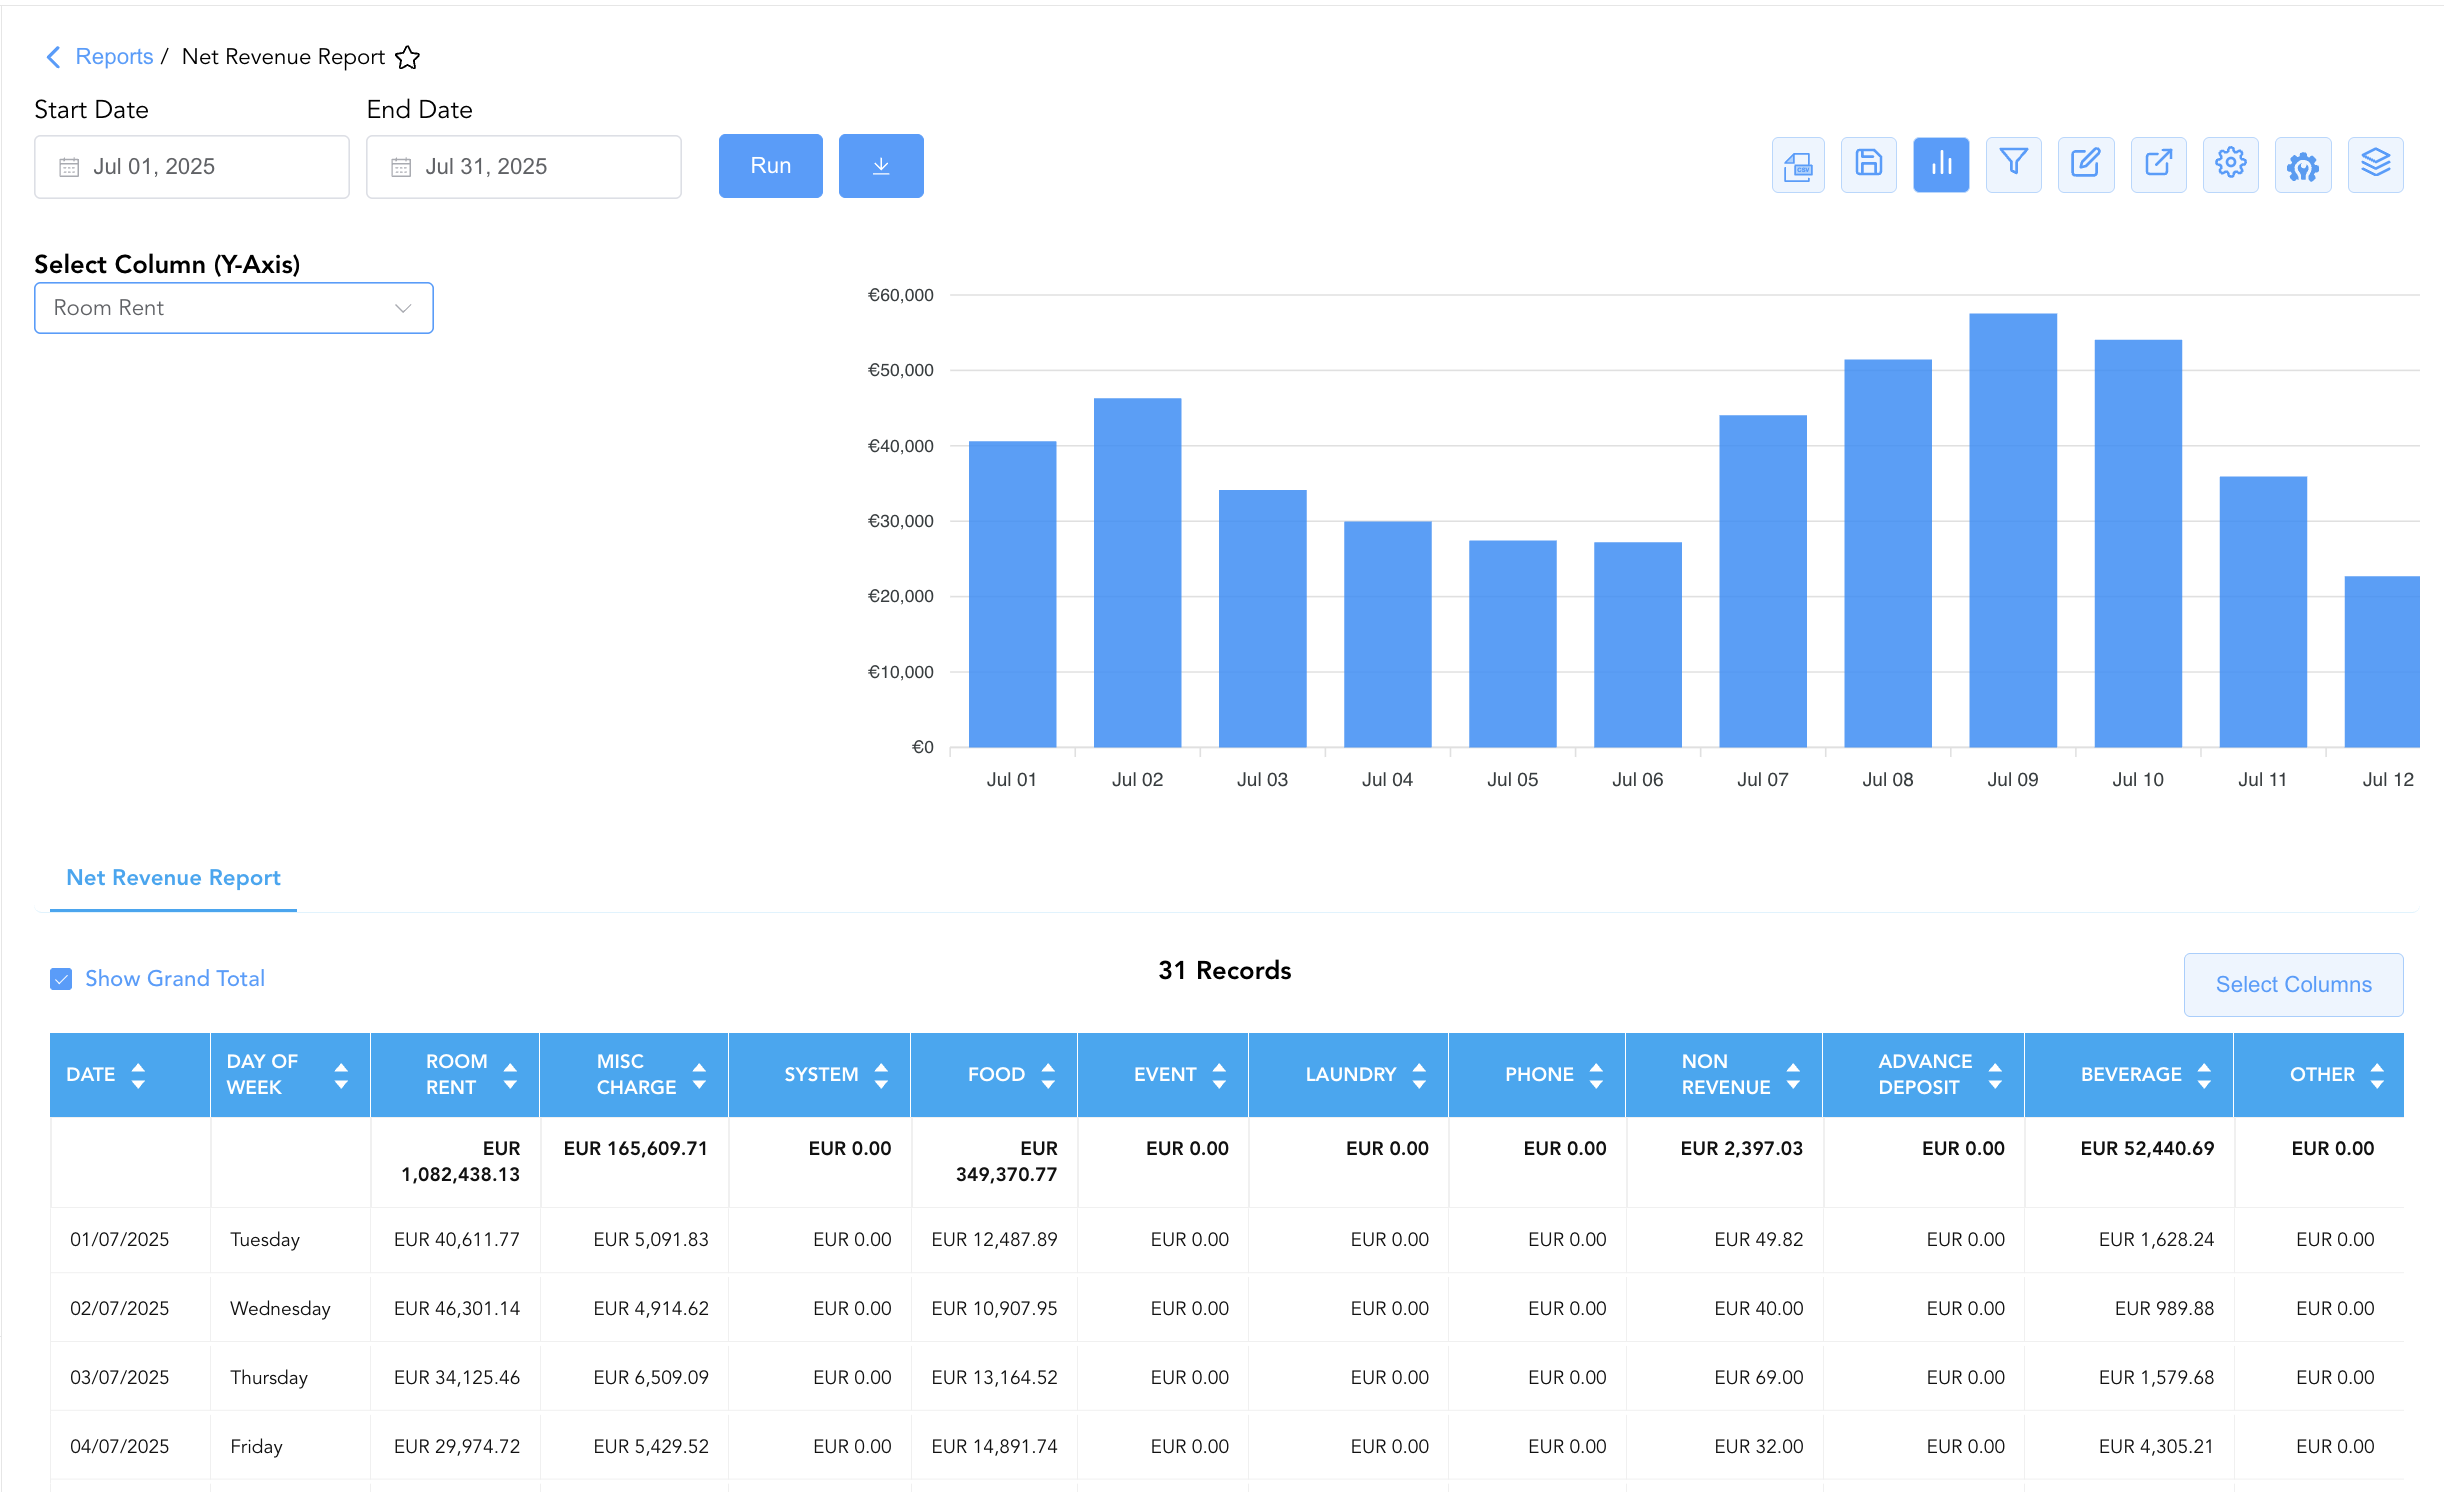
Bar Chart Visualizer: The Net Revenue Report includes a customizable bar chart that visually plots daily earnings by revenue type across the chosen timeframe. Users can adjust the chart's vertical axis using the Select Column (Y-Axis) dropdown menu to toggle between individual categories—such as Room Rent, Food, or Misc Charge—to track daily financial trends alongside the summary data table.
Advanced Controls
-
Exporting & General Ledger Auditing: Download in Excel or PDF format to support Month-to-Date general ledger tie-outs, owner financial statement preparation, and departmental budget variance reviews.
-
Filtering: Filter data by specific date ranges or non-zero collection values.
-
Highlighting (Conditional Formatting): Apply custom rules to automatically highlight high-performing revenue days or days with negative non-revenue/allowance adjustments.
🔗 Related Reports & Next Steps
Within 📈 Revenue & Analytics & 📊 Performance Summaries:
-
General Manager Report – Review property-wide macro statistics, total room revenues, ADR, and RevPAR performance.
-
Hotel Statistics – Complete 360-degree operational overview including room counts, occupancy, taxes, payments, and booking activity.
-
Daily Revenue Summary – Deep dive into daily line-item room, tax, fee, and outlet revenue breakdowns.
Cross-Pillar Deep Dives:
-
⚖️ Ledgers & Trial Balance: Reconcile net revenue realizations against General Ledger control accounts in Trial Balance or Day End Summary.
-
💳 Payments & Transactions: To inspect specific guest payments and folio transactions driving net revenue, review All Transactions.