Target Roles: Sales Managers, Event Directors, System Administrators
Last Updated:
Executive Overview
The Sales Dashboard in EventKey provides real-time visibility into sales pipeline performance, inquiry metrics, lead origins, and revenue generation. By visualizing inquiry lifecycles—from initial contact through qualified and closed business—sales leadership can evaluate owner productivity, track conversion rates, and measure actual revenue against estimated targets to drive strategy.
Configuration Guide: Navigating & Filtering the Sales Dashboard
System Navigation Path
Home > Event Management > Sales Dashboard
Step
Action
Platform Guidance & Operational Details
Access Module
From Event Management Home, select Sales Dashboard from the left navigation drawer.
Launches the main analytics dashboard containing live inquiry and revenue charts.
Define Date Range
Click the From and To calendar pickers at the top of the screen to set reporting dates.
Select specific start and end dates (e.g., full months or quarters) to filter performance data across all dashboard widgets.
Analyze Pipeline
Hover over individual segments in the interactive pie and bar charts.
Tooltips reveal exact counts, pipeline percentages, and owner breakdowns for specific inquiry states.
Evaluate Performance
Scroll to review Revenue Comparison, Conversion Probability, and Top Performers.
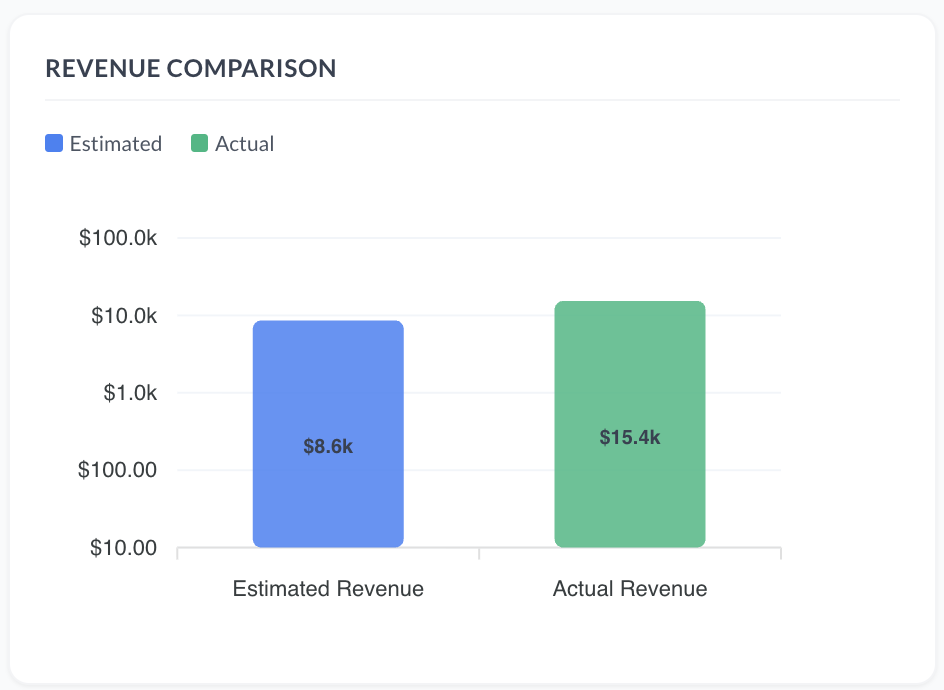
Compares estimated vs. actualized room/event revenue and ranks top sales team members and client accounts.
📷 VISUAL CALLOUT:
Sales Dashboard Walkthrough
UI Visibility & Dashboard Analytics Breakdown
The Sales Dashboard aggregates key performance indicators (KPIs) into dedicated interactive widgets:
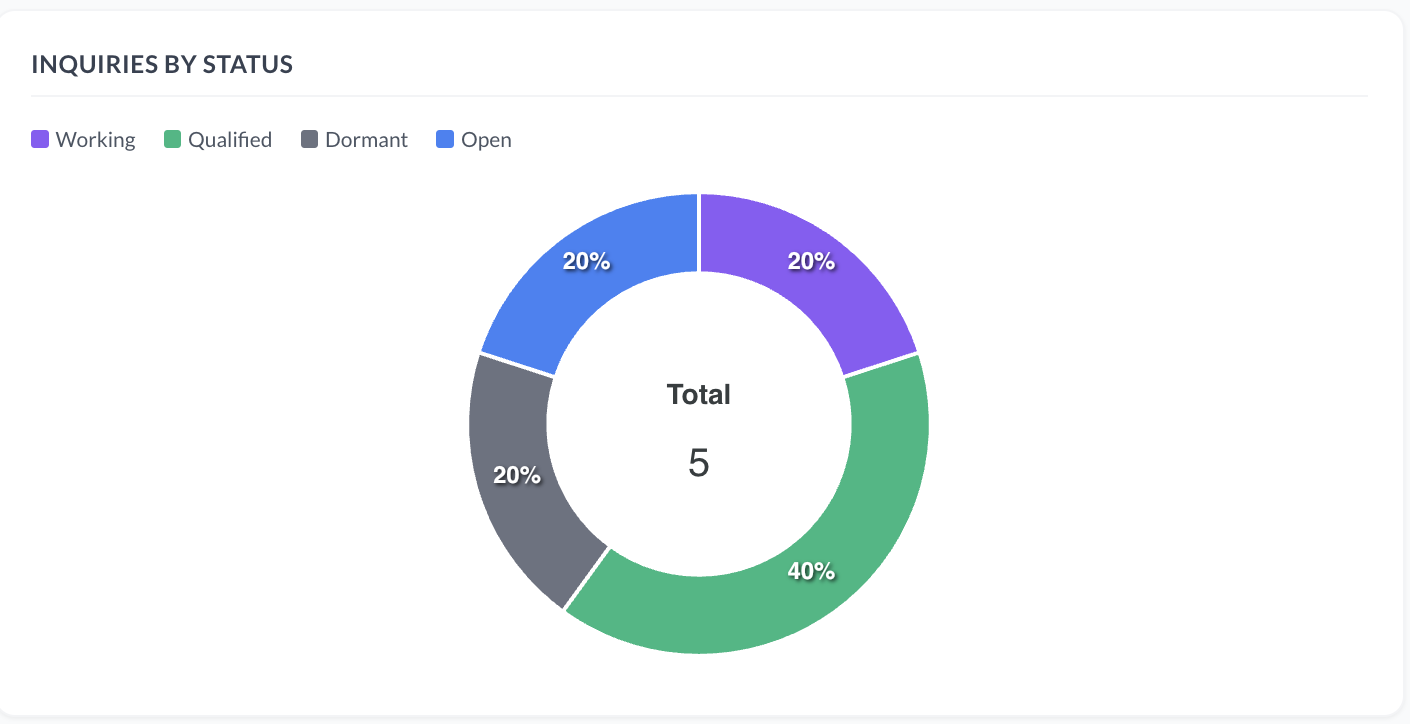
Inquiries by Status: Visualizes the breakdown of total leads across operational stages (Open, In Progress, Working, Qualified, Dormant, Turn Down, Lost).
Leads by Source: Identifies primary lead generation channels to evaluate marketing performance.
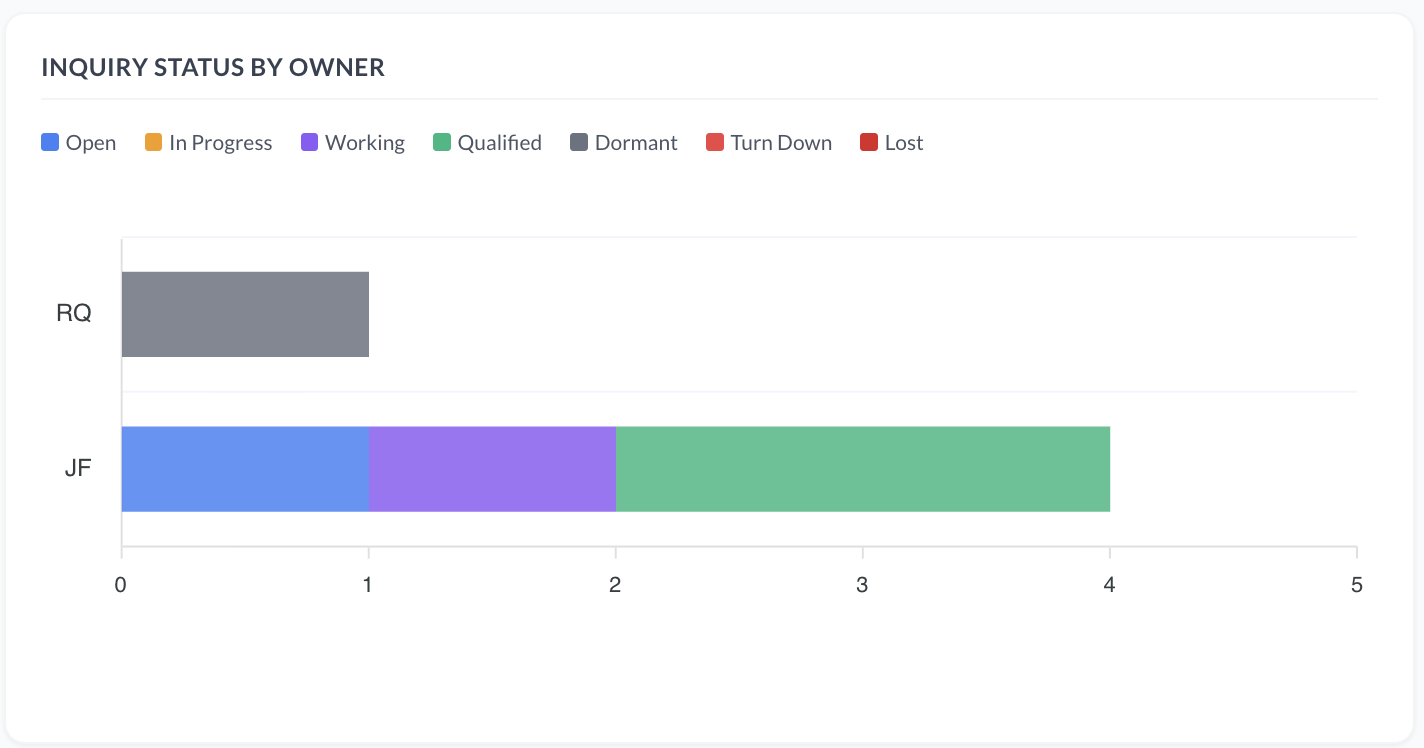
Inquiry Status by Owner: Displays bar chart breakdowns of assigned leads per sales representative (e.g., open vs. qualified inquiries per manager).
Inquiry Status by Priority: Categorizes active leads by urgency level (Low, Medium, High) mapped against status.
Conversion Probability: Displays lead conversion distribution across likelihood tiers (e.g., 0–25%, 51–75%, 76–100%).
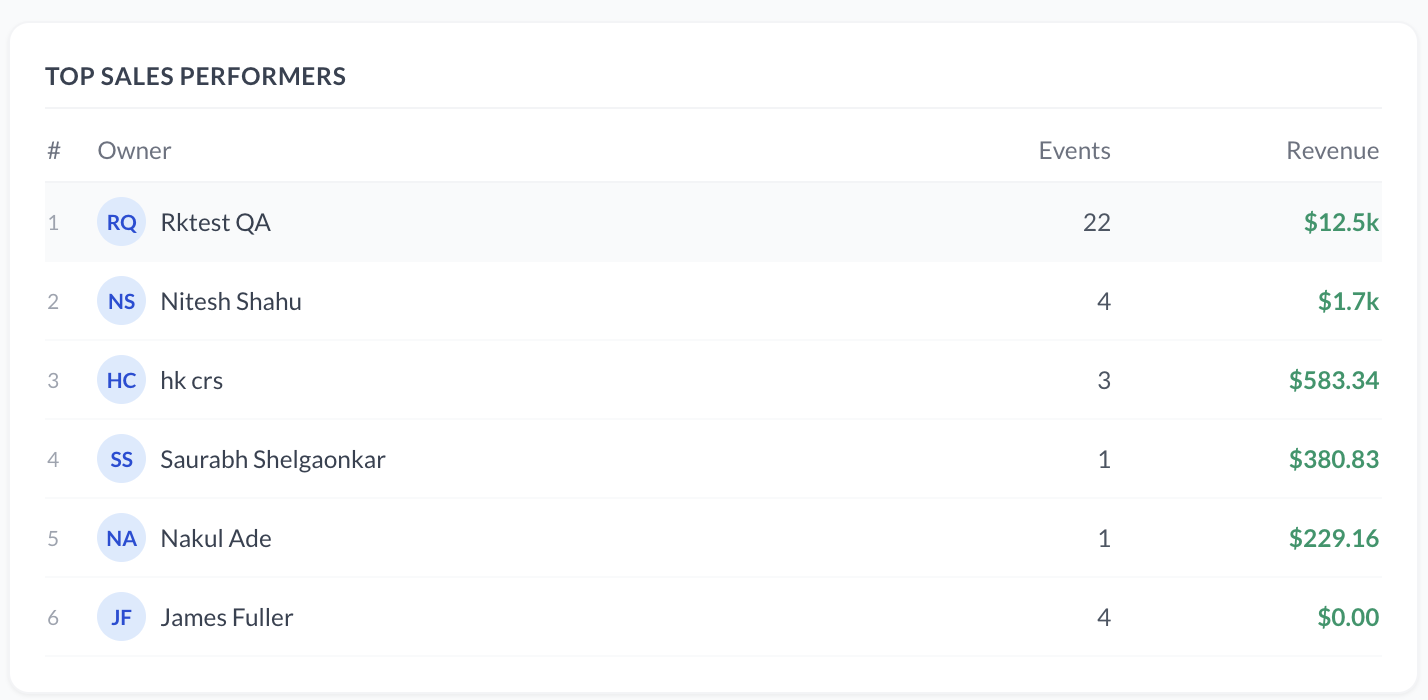
Top Sales Performers & Top Company Performers: Ranked tables highlighting individual account owners and corporate clients by total event volume and generated revenue.
📷 VISUAL CALLOUT:
(Left) Interactive tooltips on 'Inquiries by Status' and 'Inquiry Status by Owner' charts; (Right) Revenue Comparison bar charts and Top Sales Performers leaderboards.